




Sales forecast accuracy measures how close your forecast lands to what actually closed, usually expressing it as MAPE. The formula is the easy part. In Peliqan’s production data, where AI agents audit real CRMs, the bigger problem is that the number being measured is already wrong: null probability fields, placeholder deals and duplicate organisations quietly distort the pipeline before anyone calculates anything.
What sales forecast accuracy actually measures
Forecast accuracy compares what you said would close against what actually did. Most teams express it as MAPE, mean absolute percentage error, then subtract from 100 to get something that sounds like a grade.
The standard calculation looks like this:
MAPE = (1/n) x sum of ( |actual – forecast| / actual ) x 100, and accuracy = 100% – MAPE.
Run that on last quarter and you get a number. 82%, say. The trouble is that the figure tells you how well two numbers agreed, and says nothing about whether either of them described reality.
The variants worth tracking
Four refinements matter more than the headline number, and every serious forecasting process uses at least two of them.
Revenue-weighted accuracy stops a hundred tiny deals hiding one large miss. Bias, or mean percentage error, tells you whether you consistently over or under call, which is more actionable than absolute error because bias is a habit rather than noise. Horizon accuracy measures the forecast as it stood 30, 60 and 90 days out, so you learn when your view becomes trustworthy. Segment accuracy splits by team, region or product, because one bad segment usually explains an entire quarter’s miss.
A worked example, and the trap in it
Say you forecast 900,000 and closed 810,000. The absolute error is 90,000, which against the actual gives 11.1% error and 88.9% accuracy. Comfortable enough to report.
Now suppose 14 open deals worth 240,000 carried no probability value and contributed nothing to that forecast. Your real position was never 900,000, and the 88.9% describes the agreement between two numbers that both excluded a quarter of the pipeline. Recalculate with the deals included and both the forecast and the accuracy figure move, usually in opposite directions.
This is why the audit comes before the arithmetic. Any accuracy metric inherits every defect in the pipeline it summarises, and averaging hides them rather than surfacing them.
Why the formula is the easy part
Here is the failure mode almost nobody writes about, and it is the one we see most often in real CRM data.
Weighted pipeline, the number that feeds most forecasts, multiplies each deal’s value by its win probability. If a deal’s probability field is empty, that multiplication produces zero. The deal is still open, still real, someone is still working it, and it contributes nothing to the forecast. The chart renders. Nobody notices.
In one company’s production data, a CEO reviewing his own pipeline dashboard spotted a cluster of deals showing 0% probability. The AI assistant traced it to unset deal-level probability fields, then did the thing that made the difference: before changing anything, it quantified how many open deals across the whole pipeline were affected and what the corrected weighted total would be.
That order matters. A forecast that changes without explanation is worse than one that was quietly wrong, because now nobody trusts either version.
Four data defects that corrupt the input
Null probability. The deal has no probability of its own, so weighted value collapses to zero. In most CRMs the stage already carries a default probability, which means the information exists and simply is not being used.
Zero-value deals. Someone created them during discovery and never updated them. They drag average deal size down, distort win-rate-by-value, and make every segment look worse than it is.
Duplicate organisations. The same customer under a legacy trading name and a current one. Revenue splits across two rows, so neither looks like your biggest account and account-level history is broken.
Missing or stale close dates. A deal whose expected close date passed two months ago has either won, lost or slipped, and the data records none of those. It sits in the current quarter inflating the number.
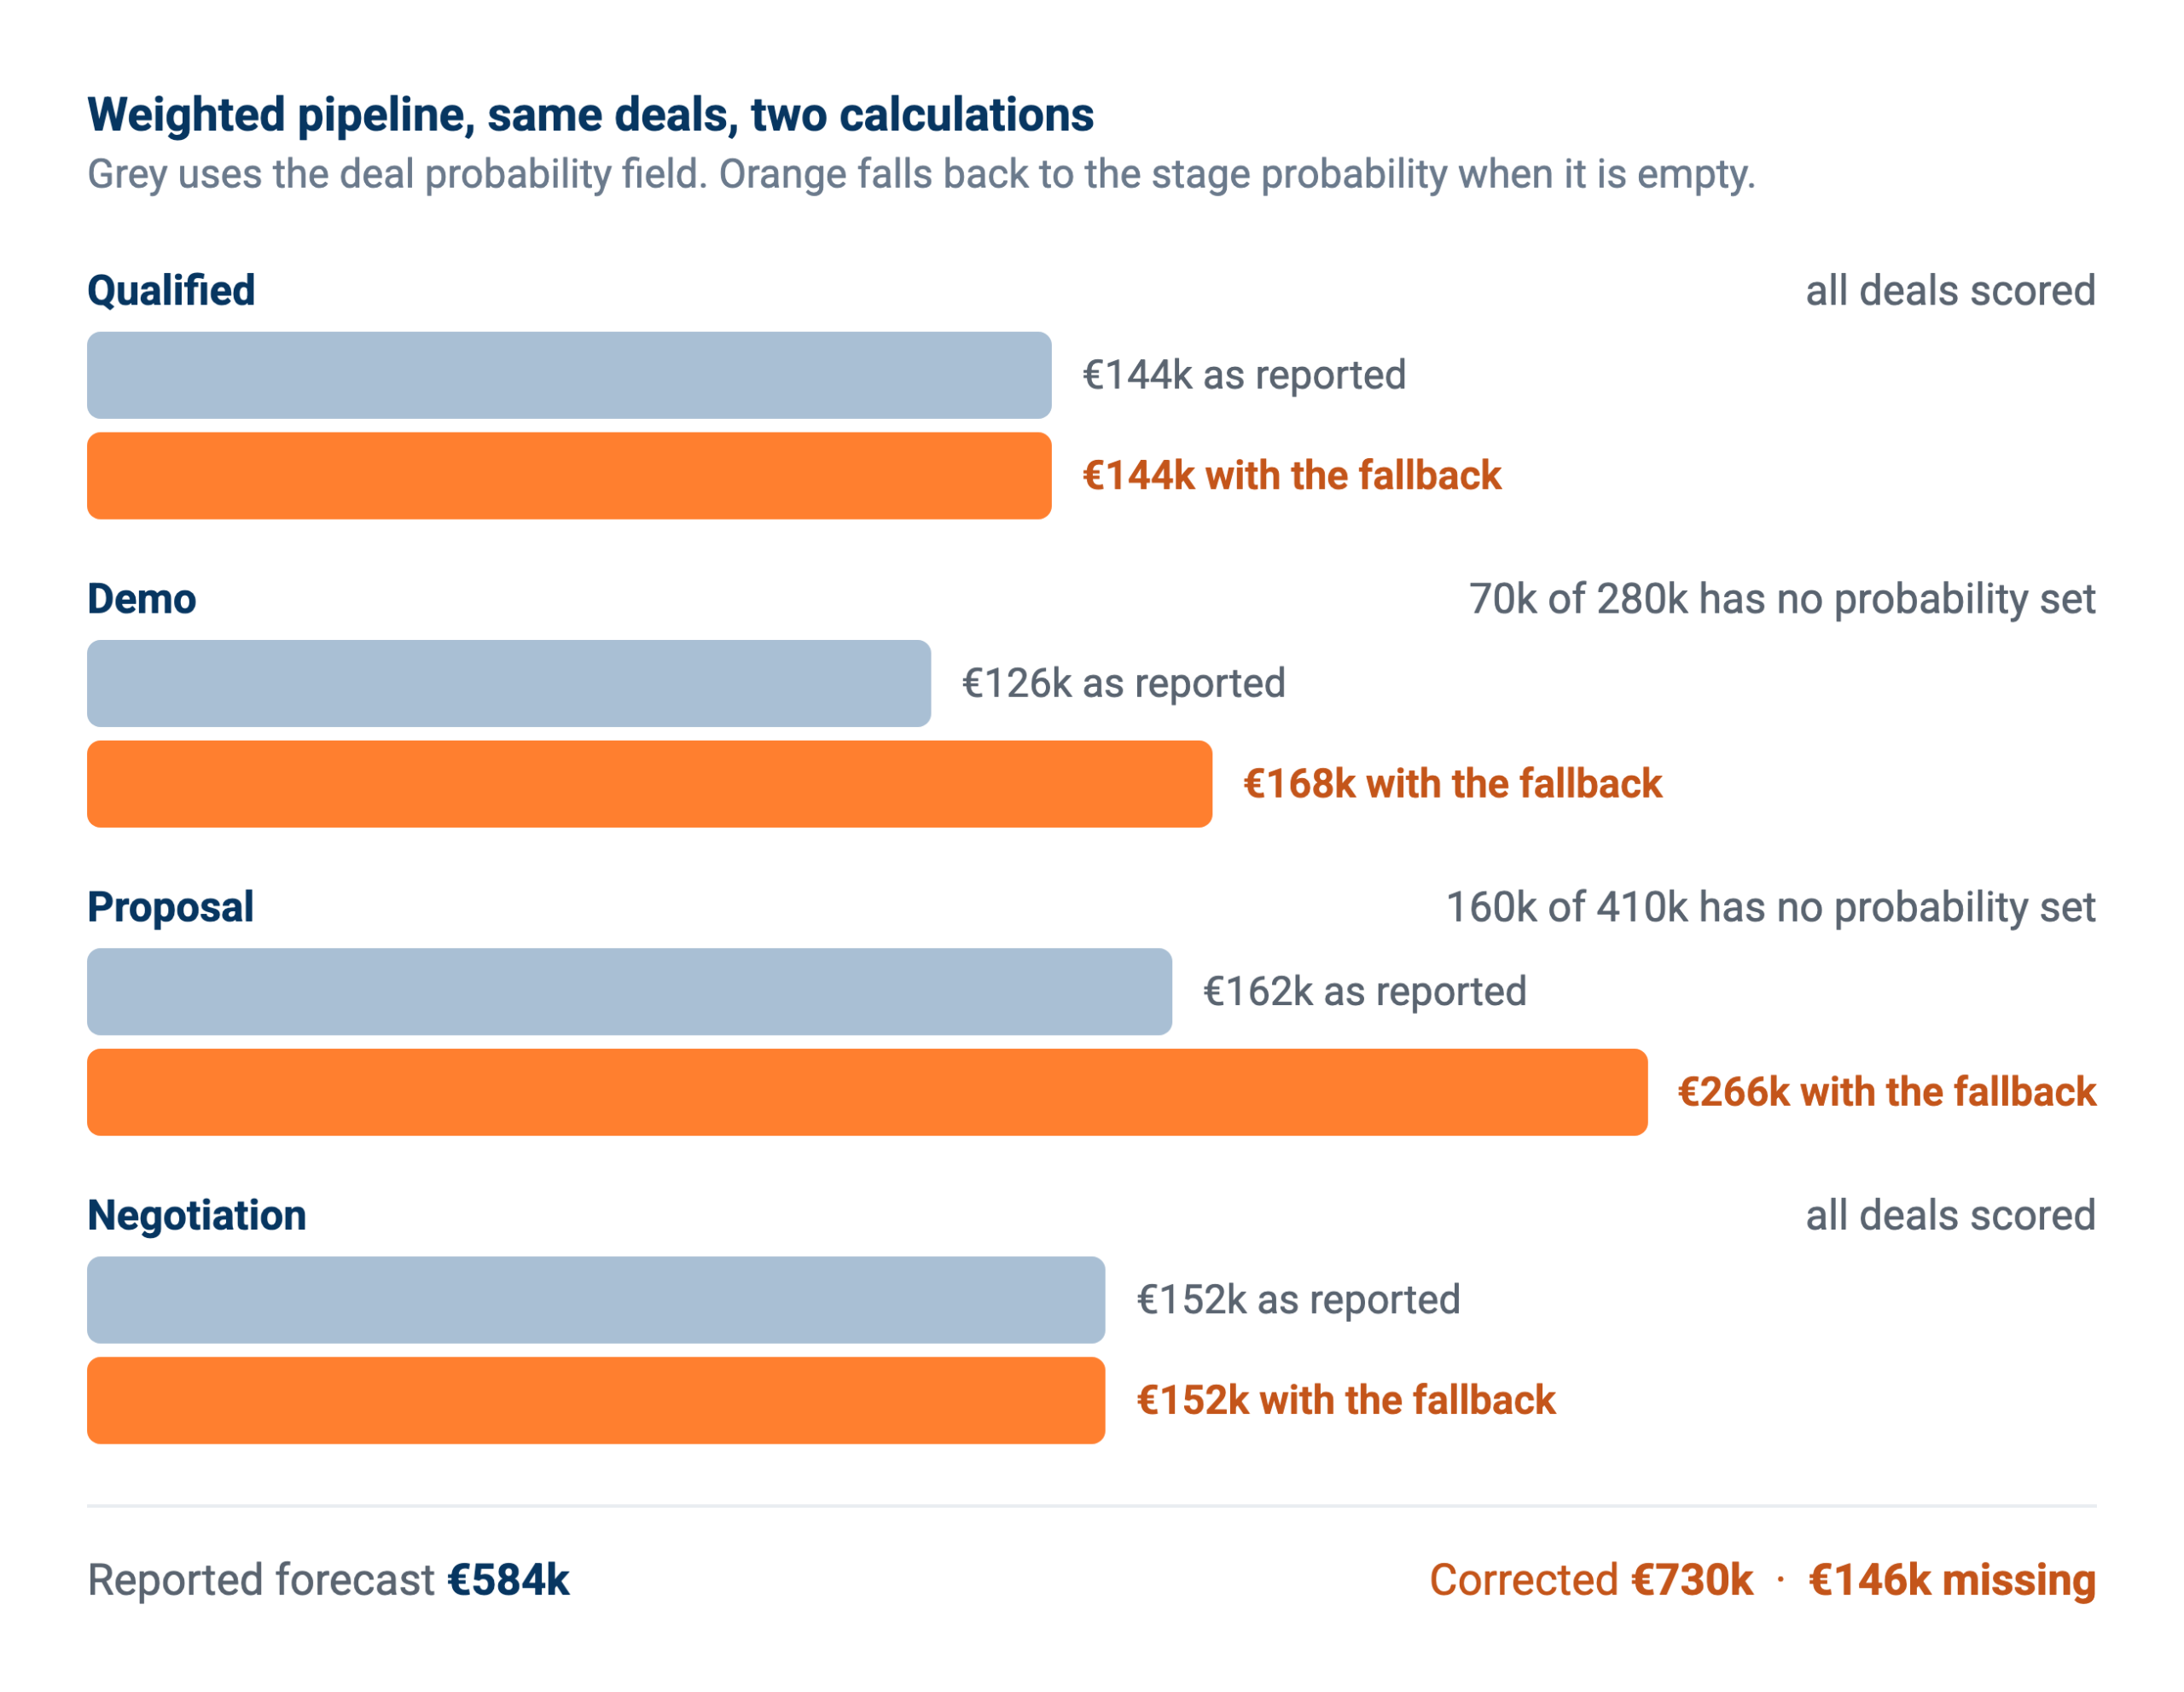
Same deals, same day, two numbers. The difference is one COALESCE.
Auditing your own pipeline before you measure anything
Each of the four defects above takes a query, not a project. Run them once and you will know within an hour whether your accuracy problem is a discipline problem or a data problem.
Count the nulls. How many open deals have no probability, no owner, or no expected close date? Express it as a share of open pipeline value rather than a row count, because one large deal matters more than forty small ones.
Find the zero-value deals. Open deals carrying a value of 0 or 1, which the usual quality practices would catch anywhere else in the business. If more than a few percent of your pipeline is placeholders, average deal size and win rate by value are both meaningless.
Look for duplicate organisations. Match on domain rather than name, since names are where the inconsistency lives. Group entities under a parent before comparing account revenue.
Reconcile closed-won against finance. Take last quarter’s closed-won total and compare it against what finance actually invoiced, the same two-system check that drives bank reconciliation. If those two disagree, fix that before publishing any accuracy figure, because you do not yet have a reliable actual to measure against.
Running these in the CRM is awkward, since its reporting serves current state rather than defect counting. It is straightforward once the CRM is synced into a data warehouse, because then each check is a few lines of SQL against tables you can join.
Fixing the weighted pipeline calculation
The null-probability fix uses a fallback: the deal’s own probability where it exists, otherwise the stage probability. In SQL that is a COALESCE between the two fields, and it takes minutes.
Two conditions before you apply it. Quantify the change first and tell people the number will move and by how much, because a forecast that shifts silently costs more credibility than it gains. Then confirm the stage probabilities are set to something defensible, since a fallback to a stage default of 50% across the board just moves the fiction one level down.
Once the calculation is right, materialise it rather than recomputing it in every dashboard. Materialised tables keep the definition in one place, which also means the number in the board pack and the number the sales manager sees cannot drift apart.
Where AI genuinely helps, and where it does not
People make two claims about AI and forecasting. One holds up.
The claim that does not hold up is prediction. Handing a model your pipeline and asking for a better close estimate produces a confident number built on the same defective fields, and now the error is harder to trace. Garbage in, plausible garbage out.
The claim that does hold up is investigation. Finding the defects above, quantifying their impact and proposing the fix is exactly what AI agents are good at, because it is pattern-matching across messy records rather than seeing the future. In Peliqan’s usage data, the pipeline work that succeeded was diagnostic: why do these deals show 0%, how many are affected, what changes if we fix it. The agent explained its reasoning in SQL, which a human could then check.
That distinction is worth holding onto: use AI to audit the inputs, not to guess the outputs. The Pipedrive MCP server gives an assistant the access to do the first job.
Guardrails matter the moment it stops reading and starts writing. Our guide to CRM agents covers the four checks any scheduled job needs before it touches a record, and a probability backfill across thousands of deals is exactly the kind of write that deserves them.
Running the audit on a schedule
Defects come back. Every new quarter brings fresh deals with unset fields, and a one-off cleanup decays within a month. Turning the four checks into scheduled data quality checks that alert when a threshold is crossed is what keeps the fix from being temporary.
The same reasoning applies to any number a business reports. We wrote about it for the month-end close, and pipeline data tends to get far less scrutiny than the ledger despite driving just as many decisions.
The operating rhythm that changes the number
Measurement alone improves nothing. Three habits separate teams whose accuracy improves quarter on quarter from teams who simply report the figure.
Review bias, not just error
Absolute error tells you the forecast was wrong. Bias tells you it is wrong in the same direction every time, which is a fixable habit rather than bad luck. A team running 15% optimistic every quarter does not need better information; it needs its commit criteria tightened.
Freeze the forecast, then compare
Comparing a forecast you kept editing against the outcome measures nothing. Snapshot the number at a fixed point, typically the first working day of the month, and treat that as the version you are graded on. Nightly snapshots make this automatic rather than a discipline someone has to remember.
Review the misses at deal level
Aggregate variance says the quarter was 12% out. Deal-level review says four deals slipped and one of them slipped because the champion left. Only the second version changes what anyone does next week, and it needs the deal history the CRM overwrote when the stage changed.
The defect nobody revisits: stage probability
Stage probabilities usually get set once, during implementation, by whoever configured the CRM. If your Proposal stage says 60% and your actual win rate from Proposal is 34%, every forecast built on that default is optimistic by design, and the fallback fix described above inherits the error.
Checking this is one query: for deals that reached each stage in the last four quarters, what share actually closed won? Compare that against the configured probability and update the configuration. Most teams find at least one stage badly out, and correcting it moves the forecast more than any process change.
Comparing the three ways to measure accuracy
Getting history the CRM never stored
Horizon accuracy needs the pipeline as it looked on a past date, and a CRM holds the current state of each record rather than its history. That is not a flaw, it is what an operational system is for, but it does mean the most useful accuracy measure is unavailable by default.
The fix is a nightly snapshot of open deals into a dated table. Keep it narrow: deal value, stage, probability, expected close date, owner. A few thousand rows a night for most teams, and after one quarter you can answer how much of the pipeline you had in January actually closed, which stages leak, and whether your 60-day view is worth anything. The same snapshot pattern underpins the dashboard work we covered separately.
One caution learned the hard way. Fix the weighted calculation before you start accumulating snapshots. Otherwise you are not storing history, you are storing a wrong number every night and building a trend line out of it.
Real-world example: Vela Group
Vela Group combined CRM, planning and accounting data into one reporting layer. Weekly KPI reporting dropped from half a day to about an hour, and they moved from backward-looking reports to nine-month forward visibility on capacity, including how marketing spend fed pipeline creation. Read the full case study.
What to do this quarter
Audit before you measure. Run the four checks. If more than a small share of open pipeline value carries a null probability, your accuracy number is measuring the wrong thing and no amount of forecast discipline will fix it.
Fix the calculation and announce the change. Apply the fallback, publish the before and after, and let people absorb the new baseline once rather than wondering why the number moved.
Start snapshotting. Even if you do nothing with it for a quarter, you cannot backfill history you never captured, so the cost of starting late is permanent.
Then work on the behaviour. Once the inputs are sound, the usual advice about commit categories, variance reviews and rep coaching starts to pay off, because you are coaching against a real number. Teams that run this through a shared reporting layer rather than per-rep spreadsheets tend to find the conversation shifts from arguing about the figure to acting on it, which is the point of the whole exercise for a RevOps function.
How Peliqan fits
Peliqan syncs your CRM into a built-in data warehouse alongside 300+ other connectors, so pipeline sits next to invoices, product usage and support data. That is what makes the four audit checks ordinary queries, and what makes reconciling closed-won against what finance actually billed possible at all.
From there the weighted calculation lives in one materialised definition rather than in each dashboard, nightly snapshots give you the history the CRM does not keep, and quality checks run on a schedule with alerts when a threshold trips. AI assistants reach the same tables through the MCP server, so the diagnostic work in this post runs against one source of truth, and queries can span systems rather than stopping at the CRM boundary.
One honest limit. None of this improves your reps’ judgement about which deals will close. It removes the data defects that make good judgement look bad, which in our experience is the larger share of a poor accuracy figure.
Send us your pipeline definition and we will show you what the four checks return against your own data.