




Self-service analytics means the person who needs an answer can get it themselves, instead of asking the data team and waiting. The idea is thirty years old. Most rollouts stall in the same three places, and what changed recently is not a better dashboard. This post covers what it actually requires, drawn from production usage rather than from a category definition.
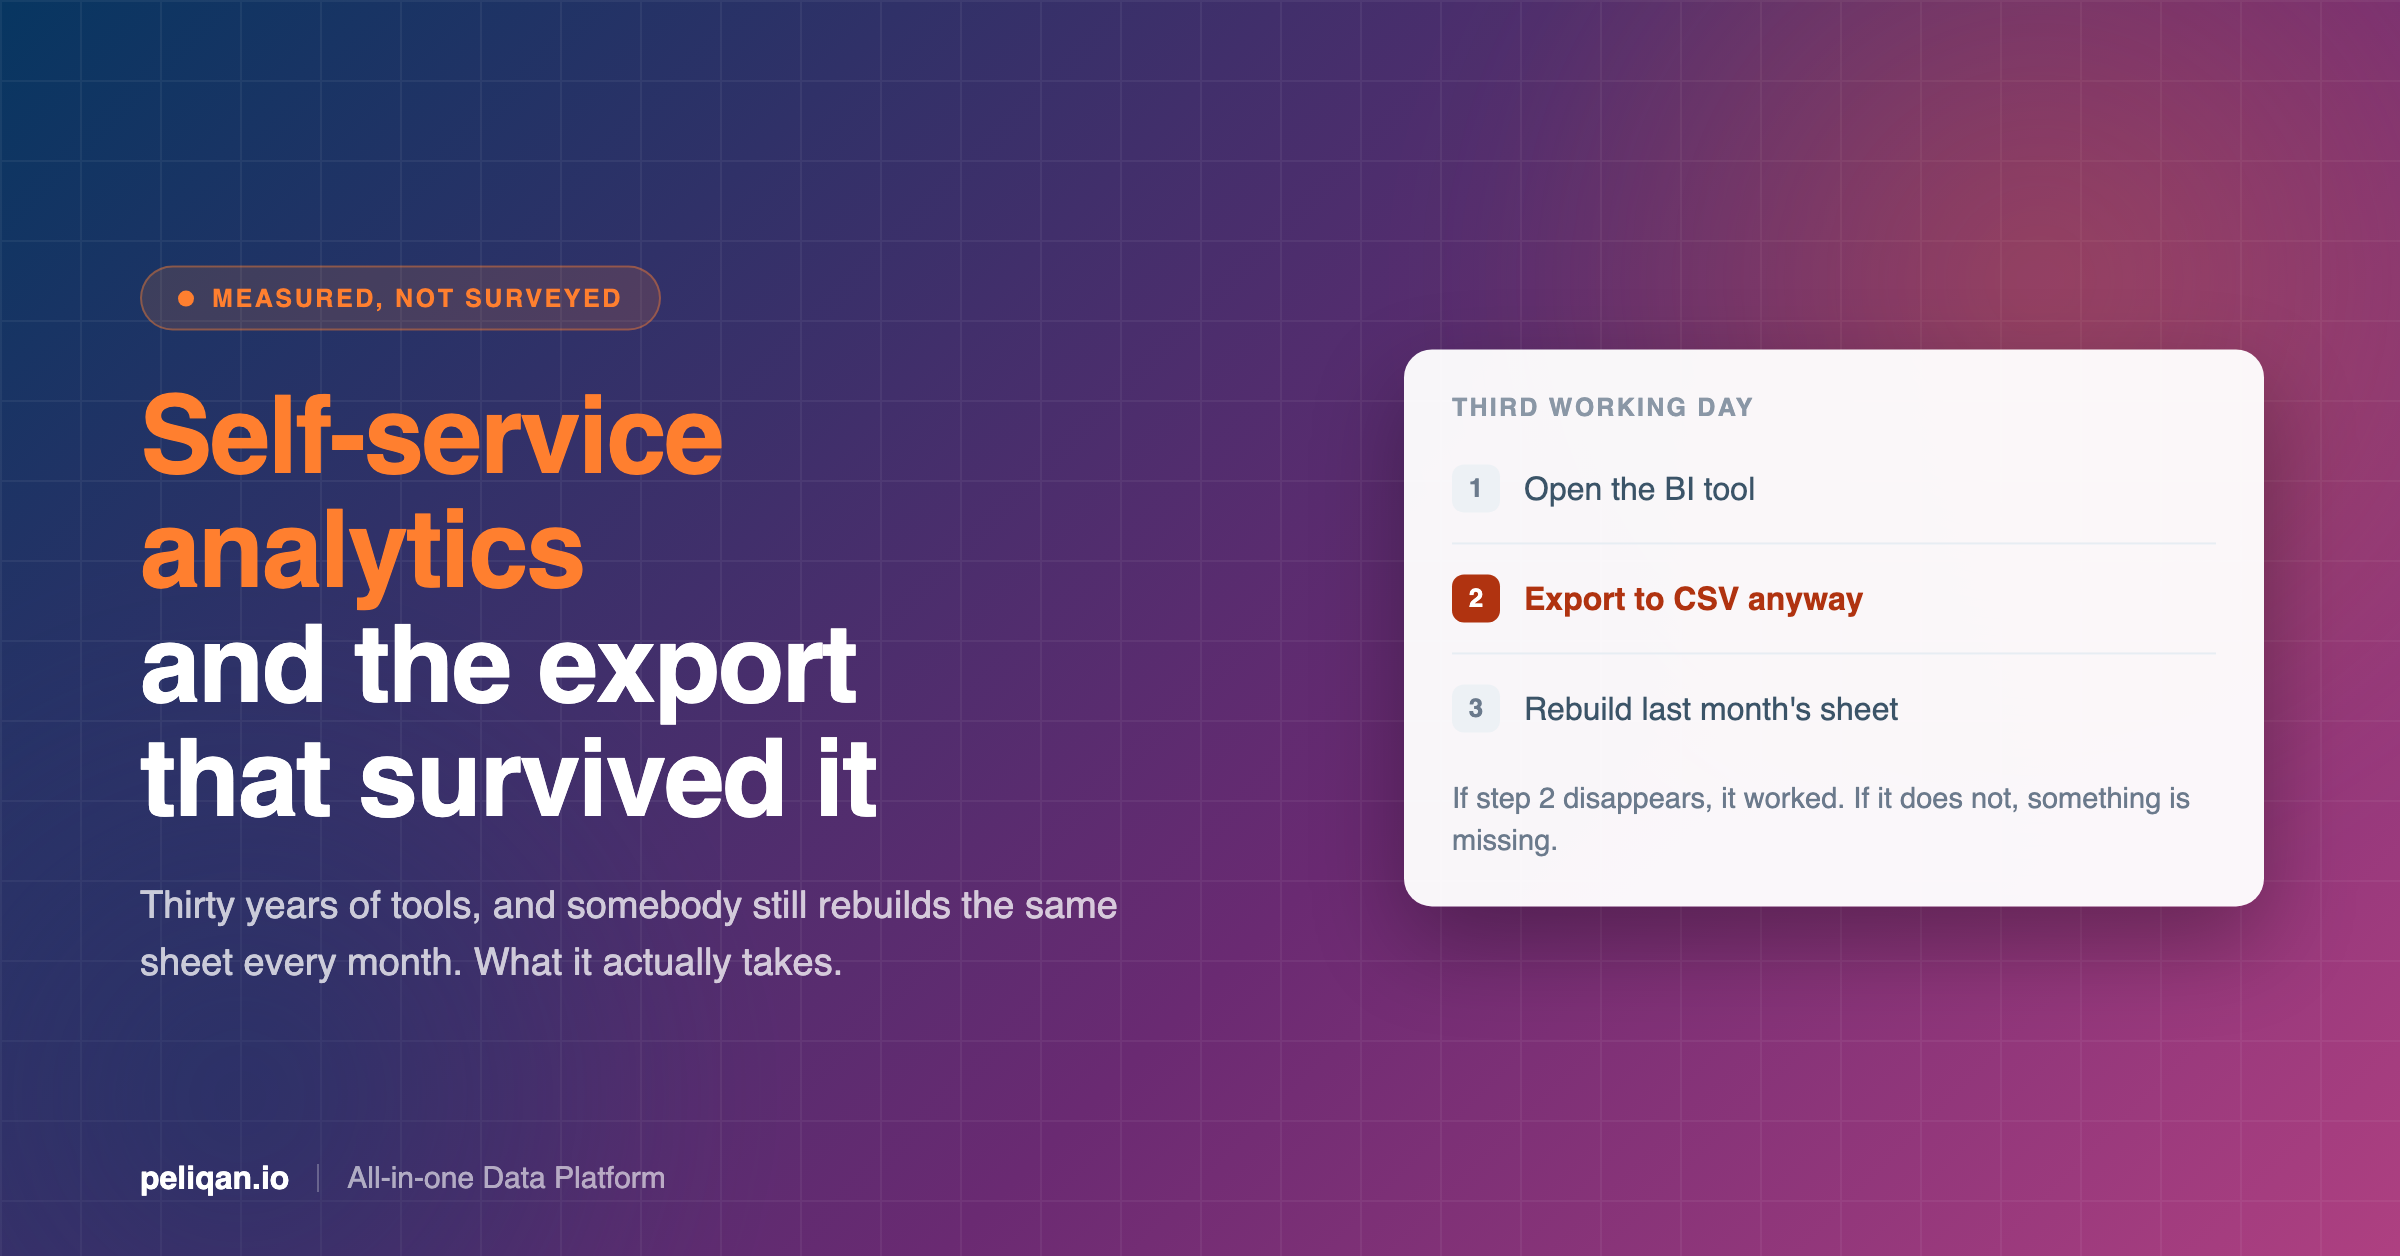
Here is the uncomfortable test for any self-service analytics programme. On the third working day of the month, does somebody still export a CSV, open it in Excel, and rebuild the same view they built last month?
In most organisations the answer is yes, and it is yes after buying a BI tool specifically to stop it happening. The export survived self-service BI, it survived the dashboard era, and it survived the migration to the cloud data warehouse.
That is worth sitting with before evaluating anything new, because it tells you the failure is not really about tooling. We can be specific about that. Across more than 5,000 production tool calls made by AI assistants against real business systems, every single connector showed somebody replacing an export, a CSV upload or a sequence of clicks. Two decades of self-service software, and replacing the export is still the job.
What self-service analytics actually means
Self-service analytics is the practice of letting non-analysts get answers from data themselves, without filing a request and waiting for someone else to run it.
The definition is easy. What it means in practice varies enormously, and that is where programmes succeed or fail. Vendors sell three quite different things under the label.
Self-service reporting. Someone builds dashboards; business users read them and filter them. This is the most common version, and the least self-service of the three. The user can slice a question somebody anticipated. Anything unanticipated goes back to the queue.
Self-service exploration. Business users build their own views against a governed model. Closer to real self-service. It also asks people to learn a tool and understand the data model, so adoption usually stops at the handful who were going to learn SQL anyway.
Self-service questioning. Someone asks in plain language and gets an answer. This is what everyone actually wanted. It did not work reliably until recently, and that is what changed.
Most tools sell the third and deliver the first. Working out which one you are buying is the most useful thing you can do in an evaluation.
Why the promise keeps failing
The failure patterns repeat often enough to predict, and switching vendors fixes none of them.
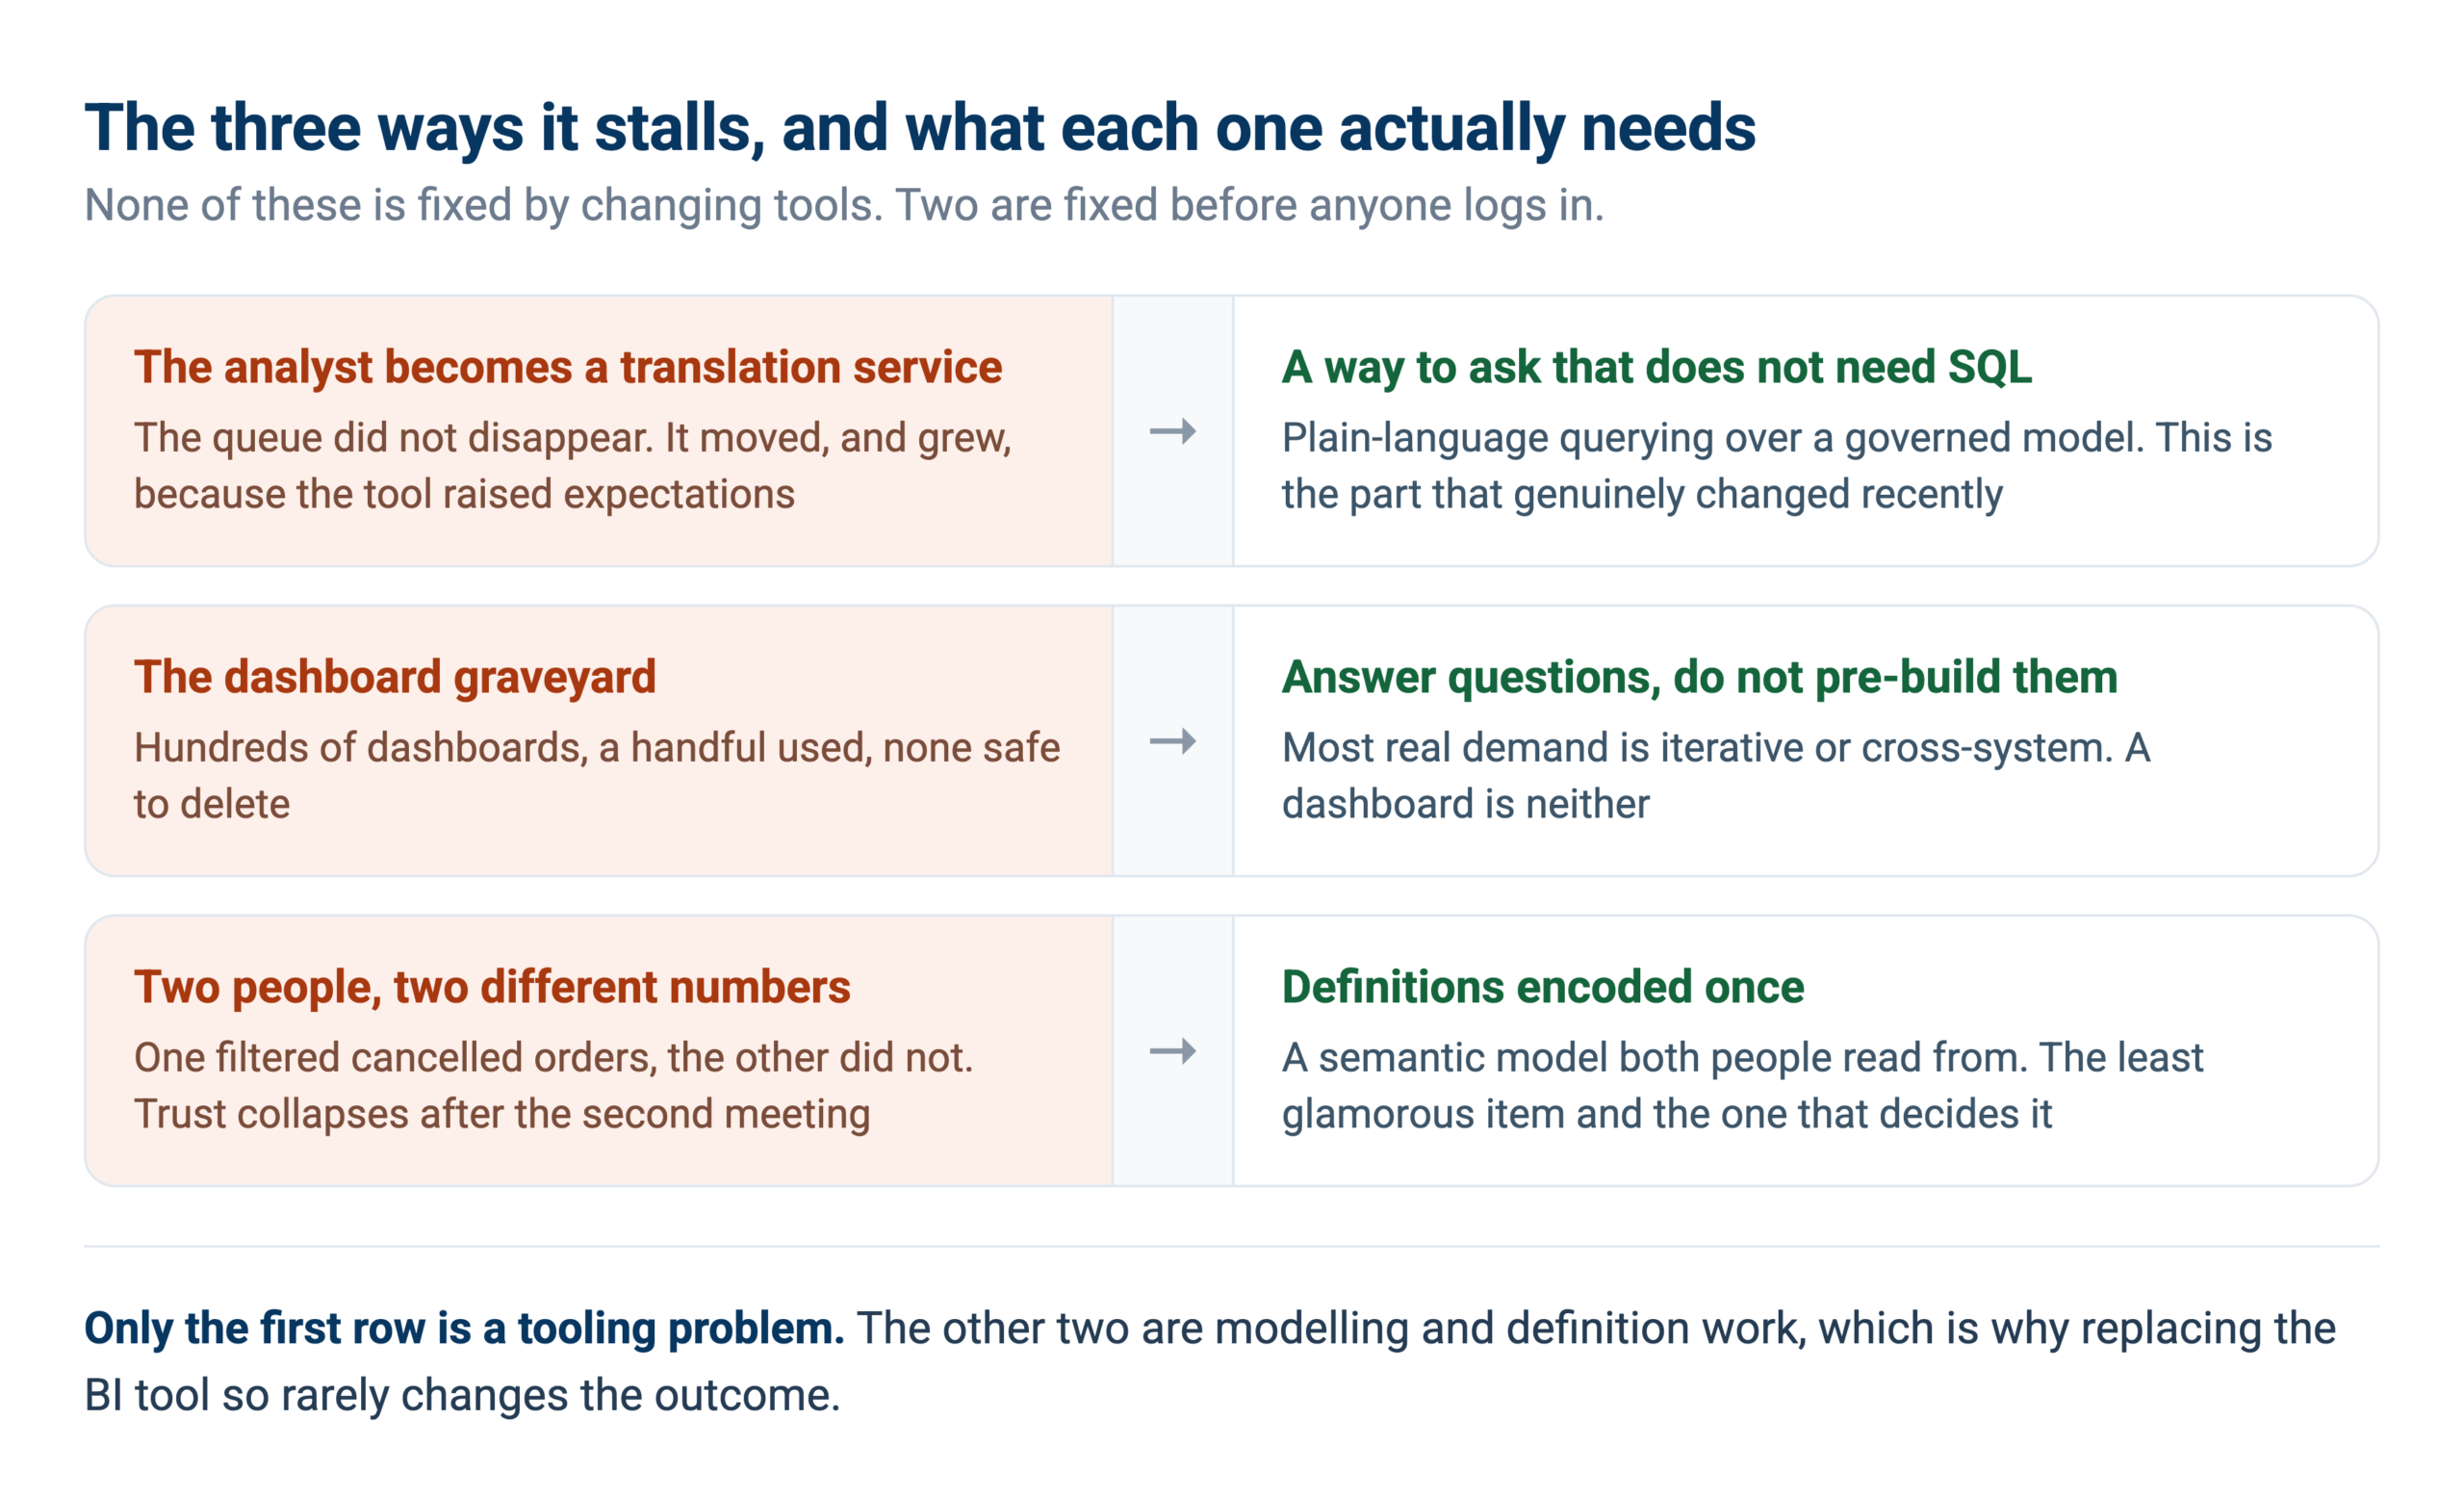
The analyst becomes a translation service
The most common end state. Somebody deploys the tool, people cannot get what they need from it, and they go back to asking the data team, who now translate English into SQL all day. The queue did not disappear; it moved and grew, because the tool created the expectation that answers should be quick.
This one is worth naming clearly because it looks like success from a distance. Licence numbers look healthy, usage climbs, and the analytics team carries more load than before.
The dashboard graveyard
Every organisation past a certain size has hundreds of dashboards, of which people use a handful. Each answered a question that mattered once. Nobody can safely delete any of them because somebody might be relying on one, so they accumulate, and finding the right one becomes harder than asking a person.
Everyone computes the number differently
The most damaging failure, because it destroys trust rather than merely wasting time. Two people answer the same question and get different figures. One filtered out cancelled orders and the other did not, or “active customer” means one thing in the CRM and another in the ledger.
Once that happens twice in a meeting, people stop trusting the self-service layer and go back to asking the person they trust. No tool fixes this. You fix it by agreeing definitions and encoding them somewhere both people read from, which is the job of a semantic model.
What people actually ask when you give them self-service
This is where production data is more useful than a category definition. Give people a genuinely open way to ask questions of business data and the questions take a shape, and it is not the shape dashboards serve.
The recurring report, without the export. The single largest category. Monthly profit and loss, budget versus actual, aged receivables, revenue by customer and month. These are not novel questions. They are the questions someone was already answering by hand every month, and the value is removing the assembly work rather than discovering anything new.
Reconciliation between two systems. The most repeated job across every system in the data. A ledger against a margin workbook. A webshop against invoices against bank transactions. An ERP against advertising spend. Notably, this is a question no dashboard answers, because it spans two sources that were never modelled together.
Chasing a discrepancy to its source. A total is a few hundred off and somebody needs to know why. This is iterative by nature: query, narrow, requery. It is the opposite of a dashboard interaction, and it is where the time actually goes in finance and operations work.
The follow-up. Almost every session in the data is a sequence, not a single question. Someone asks, sees the answer, and immediately asks a better question. That is the whole case against dashboards here: a dashboard answers the first question and cannot hear the second.
Why this matters for tool selection
Three of those four patterns are either cross-system or iterative. Dashboards are neither. Most of the real demand spans sources and changes with every follow-up. A tool that answers pre-built questions on one source will always feel like it is missing the point, however good it is at that.
What actually changed
For most of the history of this category, self-service meant giving someone a tool and hoping they would learn it. The interface was the barrier, and no amount of drag-and-drop removed it, because the real barrier was never the interface. It was needing to know how somebody had structured the data before you could ask anything.
Asking in plain language removes that specific barrier, and it is a genuine change rather than a repackaging. Someone asking “which customers with open deals have overdue invoices” does not need to know which tables those live in, how they join, or what the status codes mean. Something in the middle has to know instead.
That last part is the whole story. Plain-language querying without a governed model underneath produces answers faster and wrong, which is worse than the queue it replaced. Speed multiplies whatever you give it, and it multiplies inconsistent definitions just as happily as good ones.
The four things that have to be true
From the setups that worked, as distinct from the ones that stalled.
1. The data is in one place
Reconciliation and cross-system questions make up most of the real demand, and neither works while each system answers separately. Getting the sources into one place you can query is the dull first step, and it decides whether the interesting questions can be asked at all.
2. Write the meaning down where a machine can read it
Table and column descriptions, documented relationships, and definitions for the business terms your team argues about. If “active customer” has three interpretations, pick one and encode it in a semantic model rather than re-arguing it on every question.
This is the least glamorous item on the list and the one that most determines whether answers are consistent. It is also the one teams defer, because it looks like documentation work with no visible output until the day two people get the same number.
3. Scope access to the person asking
“Which customers are overdue” should return different results for a regional manager than for the CFO. If everything runs through one shared service account, it does not, and nobody notices until someone sees a number they should not have.
Worth being precise about how this works, because it is easy to assume a feature exists when it does not. In Peliqan, permissions are set at schema level through Groups with Admin, Member and Viewer roles. You build row-level scoping for an AI agent by giving it a set of views carrying a permission column, then applying the filter in the API handler between the chat interface and the data. It works, and it is something you build rather than switch on.
4. Freshness is visible
An answer with no timestamp gives you no way to tell whether it is current. In the production data, users working from synced data checked how current it was constantly, before trusting anything. They were right to: a number from a copy that stopped updating eleven days ago is indistinguishable from a current one.
Surface the last sync time next to the answer, and alert on staleness with quality monitoring rather than trusting that a green pipeline means fresh data.
Where it still fails
The honest section, because this category has a long history of promising more than it delivers, and the current generation is no different.
Generic tools produce confident nonsense. The clearest technical finding in our data: where a tool gave a model open-ended access and left it to work out the request shape, error rates ran at 44%, 64%, 89% and in one case 100%. Purpose-built operations against the same systems worked reliably. Ask any vendor whether their AI gets named operations mapped to real jobs or a general-purpose hook, because the second sounds more powerful and behaves considerably worse.
A wrong answer sounds as confident as a right one. A wrong answer arrives formatted exactly like a right one. There is no visual signal, no hedge and no error. This is the single biggest behavioural difference from a dashboard, which at least fails visibly when a query breaks.
It does not remove the need to model. Plain language changes who can ask, not whether the underlying data makes sense. The modelling work moves earlier and becomes more important, not less.
Judgment stays human. Assembling the evidence is the automatable part. Deciding what to do about it is not, and any vendor implying otherwise is selling something the production evidence does not support.
Governed or open, and why the answer is both
The long-running argument is whether self-service should be governed or open. Governed means people query a curated model. Open means they can reach the underlying tables.
Both camps are describing a real failure. Fully governed setups are trustworthy and often useless. The model answers what somebody anticipated, and the first genuinely new question goes back to the queue, which is the original problem again. Fully open setups answer anything and produce the third failure above, where two people compute the same number differently and trust collapses.
What the working setups do is neither, and it is worth stating plainly because it is not usually how tools are sold. They govern the definitions that get argued about, and leave everything else open.
In practice that means two things. A small number of modelled views covering the concepts your business reports on, things like revenue, active customer and margin. Then open access to the tables underneath. Someone asking about revenue gets the agreed definition every time. Someone asking a question nobody anticipated still gets an answer, and everyone treats it as exploratory rather than official.
The mistake is treating governance as an all-or-nothing setting. The useful question is not “should this be governed” but “which specific numbers must be identical for everybody”, and that list is usually much shorter than a governance programme assumes.
How to tell whether it is working
Most self-service programmes measure adoption, which tells you close to nothing. Licences deployed and weekly active users tell you people opened the tool, not that they got anything.
Four measures that mean something:
Has a specific manual process stopped? The clearest signal available. Name the export or the recurring request before you start, then check whether it still happens in month three. It is a yes or a no, and hard to argue with.
Has the analyst queue shortened? Not the number of tickets, which can rise as expectations grow, but the proportion that are genuinely novel. If your data team is still answering “what was revenue last month” the layer is not working, whatever the usage chart says.
Do two people get the same number? Ask two people in different teams the same question independently and compare. It is a five-minute test and it surfaces the trust problem before a meeting does.
What do the questions look like over time? The healthiest signal in the production data was sequences: someone asks, then asks a better question, then a better one. Sessions that are single questions usually mean people are checking a figure they already expected. Sessions that build mean they are actually investigating something, which is the behaviour the whole exercise is for.
None of these need a dashboard to track. Three of them need somebody to look at what people asked, which is why query logging is worth having from day one rather than added after the first dispute.
How to roll it out without repeating the usual failure
Based on what distinguished the setups that worked.
Start with the export somebody already does. Not the most impressive use case, the most repetitive one. It has a known right answer, which means you can verify the system before trusting it, and somebody already wants it gone.
Connect one source properly rather than five badly. Breadth is tempting and it produces a system nobody trusts. Depth on one source produces the first genuinely useful answer.
Model the joins and definitions before opening access. Build the views that encode how your business actually reports. Every hour here saves several later, and it is the difference between consistent answers and an argument.
Test against a period you have already closed. Run last month’s questions where the verified numbers exist. This is how you learn whether the setup is trustworthy while the stakes are zero.
Give it to one team first. Broad rollouts produce impressive launches and quiet abandonment. One team with real questions produces the evidence for the next expansion, and the objections you need to hear early.
Watch what people ask, not whether they log in. Adoption metrics measure licences. The questions people actually ask tell you whether the thing is useful, and they tell you what to model next.
Real-world example: multi-client reporting
Firms reporting across many separate client environments hit every problem above at once, and solve it the same way: unify the sources first, model once, then let people ask. The guide to multi-client reporting covers the pattern.
Where Peliqan fits
Peliqan follows the order of operations above: land the data, model it once, then open access.
Data from 300+ connectors syncs into a built-in data warehouse running Postgres and Trino, which is what makes the cross-system questions possible.
You model the joins and definitions as SQL or Python transformations, so the meaning lives in one place rather than in each person’s head.
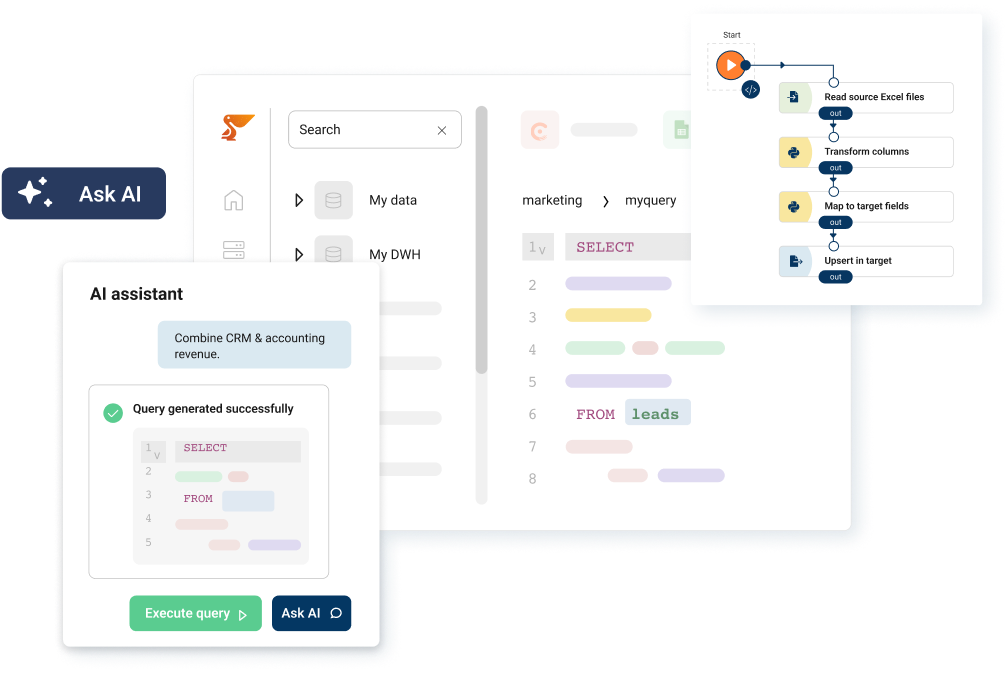
From there, three ways to consume it, which is deliberate given how differently people work. There is a built-in Metabase for dashboards and exploration, and an SSL Postgres endpoint for Power BI, Tableau, Looker or Qlik if your organisation already standardised on one.
Third, the MCP server lets people ask in plain language from Claude or ChatGPT.
That third path is the one this post is mostly about. It answers from the synced copy rather than by calling your source systems, so exploration does not eat into anyone’s API quota. The piece on cross-source SQL covers questions that span several systems.
Governance sits at the platform level: permissions through Groups at schema level, queries and writeback logged, SOC 2 Type II certified, ISO 27001:2022 certified, GDPR compliant and EU-hosted. If you are weighing how an assistant should reach your data in the first place, the CLI and MCP comparison covers that decision, and governance practice covers the rules around it.
The takeaway
Self-service analytics keeps failing for a reason that has nothing to do with interfaces. People do not want to build reports. They want answers to questions that change every time, frequently span two systems, and usually start as a follow-up to the last answer.
Dashboards were never going to serve that, which is why the export survived them. Plain-language querying can, but only over data that is in one place, modelled once, scoped properly and honest about how fresh it is. Skip any of those four and you get wrong answers faster, which is a worse outcome than the queue.
The test at the top of this post is still the right one. If the CSV export on the third working day disappears, it worked. Still there, and something in the four is missing.
To check that against your own systems, book a demo and bring the report somebody rebuilds by hand every month.