

A KPI dashboard shows the few numbers that tell you whether your business is on track. This guide explains what a KPI dashboard is and gives examples for each team. Then it shows how to build one, step by step. It also covers the part most guides skip: getting the numbers out of your business apps, and keeping them right.
What is a KPI dashboard?
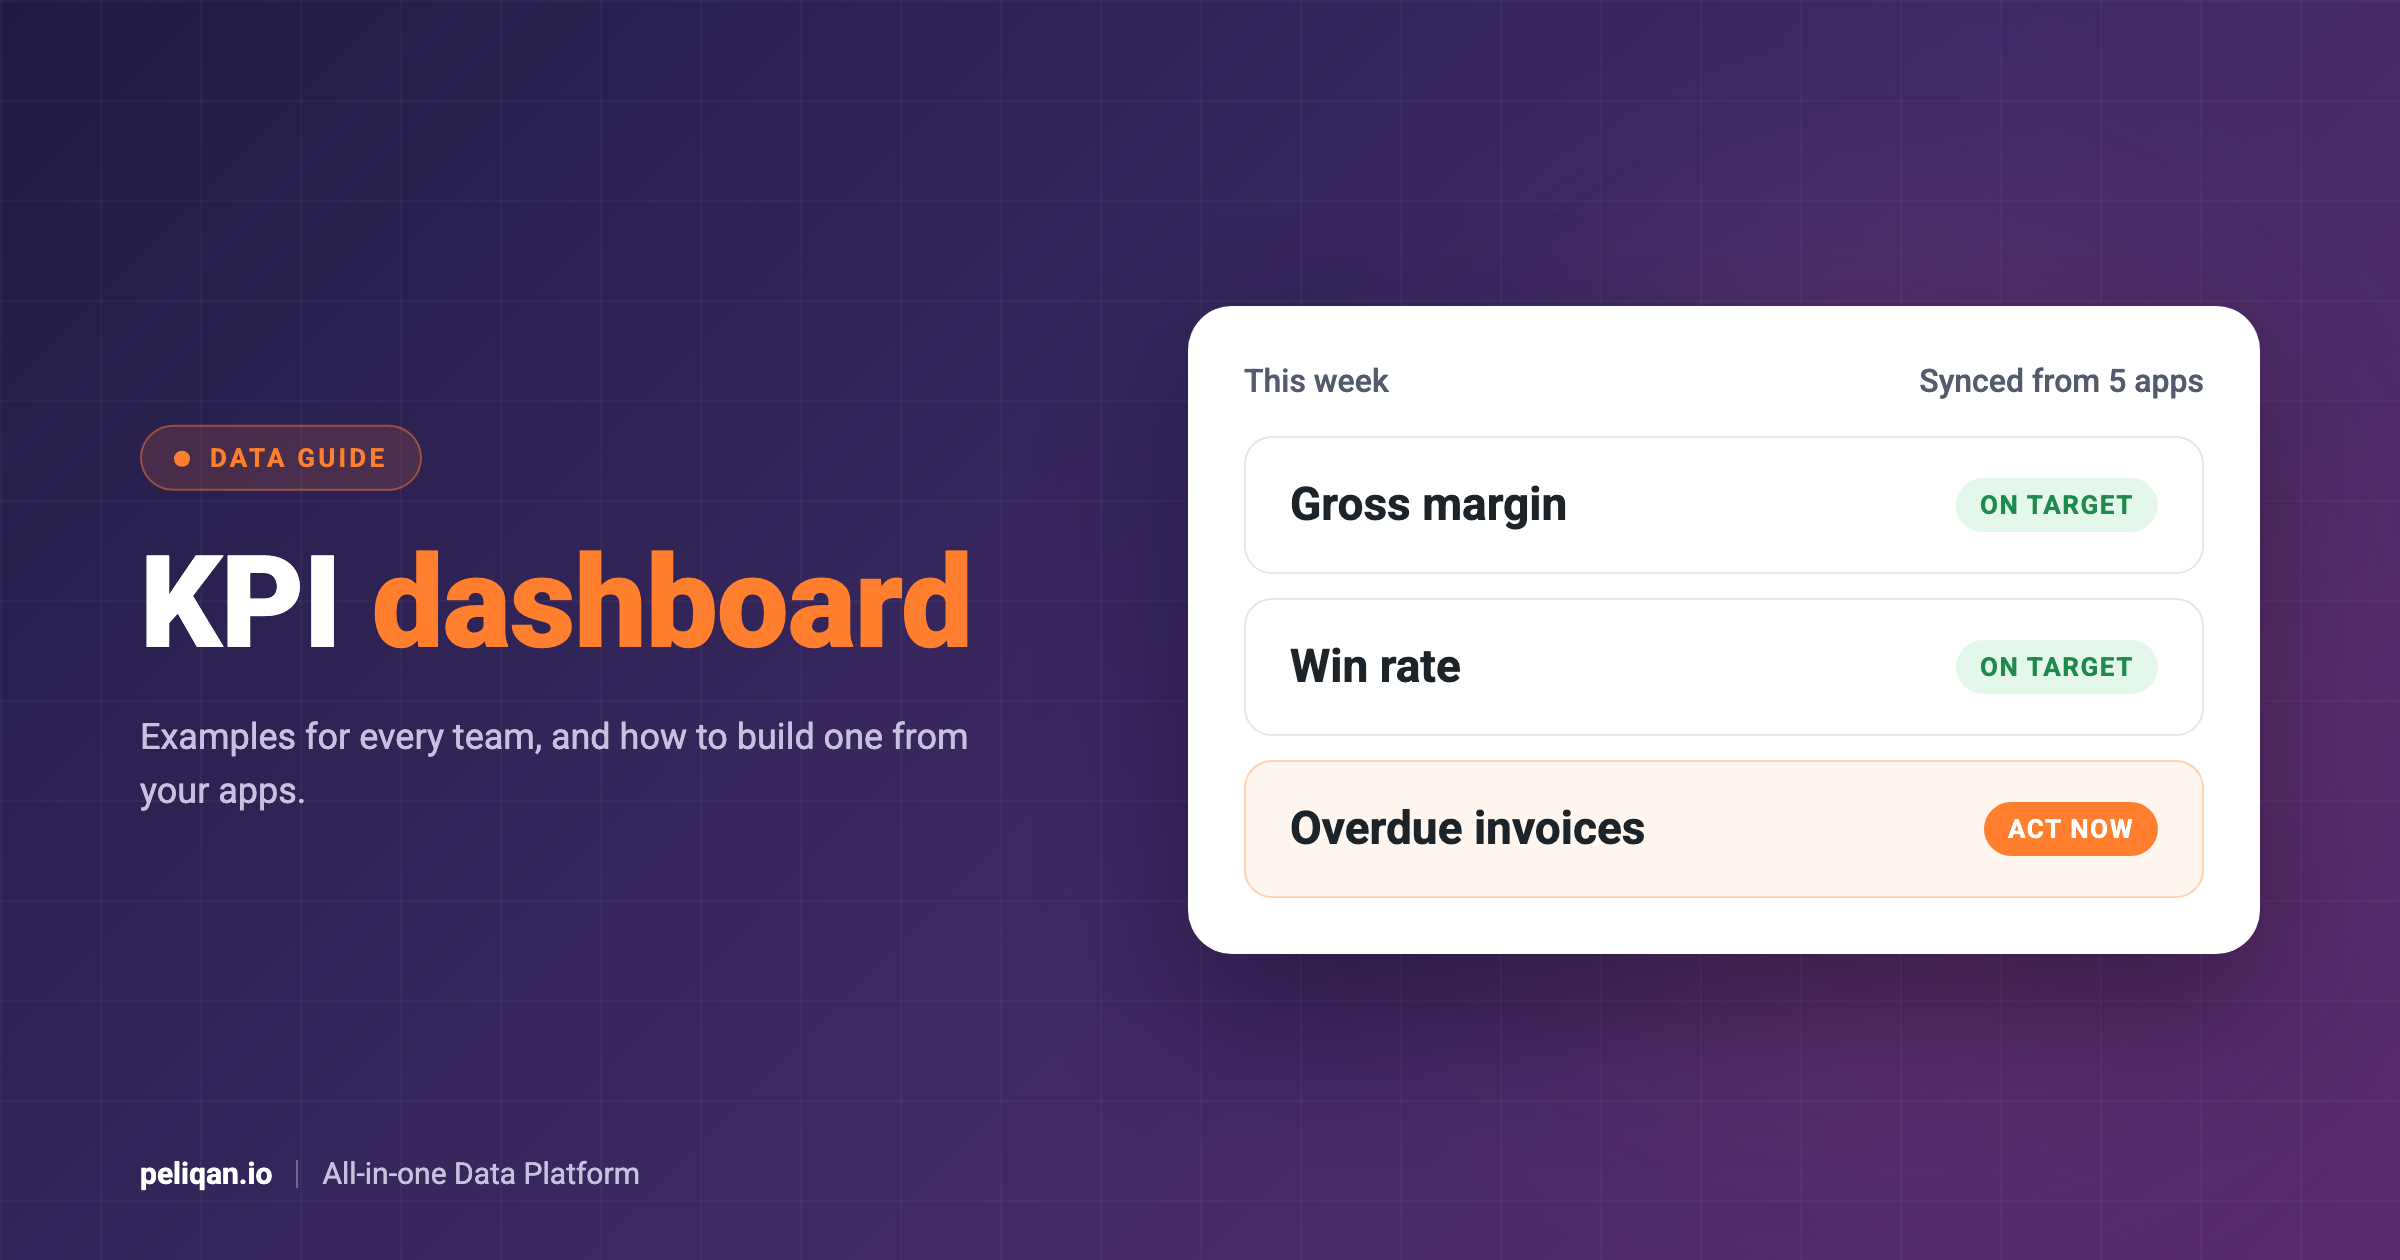
In short, a KPI dashboard is one screen that shows your key performance indicators (KPIs), each with a target and a trend. For example, a finance dashboard might show revenue, gross margin, cash in the bank and overdue invoices. Next to each number, you see last month and the goal. As a result, you can spot at a glance what needs attention.
Here, the word “key” matters. A metric is any number you can measure, such as page views or calls made. A KPI, however, is one of the few metrics tied directly to a goal. So a good KPI dashboard shows five to ten numbers, not fifty.
Also, a dashboard is different from a report. A report, for example, explains what happened in a period, often in detail. A dashboard, by contrast, shows where you stand right now, and people check it often.
Types of KPI dashboards
In general, KPI dashboards fall into three types. The type decides who looks at it, how often it updates and how much detail it needs.
KPI dashboard examples by team
The table below shows typical KPIs for each team, and where the data usually lives. Notice that almost every team needs data from more than one app. That is why the dashboard itself is often the easy part. Getting the data, on the other hand, is the hard part.
For sales teams on Pipedrive, our guide to a Pipedrive dashboard goes into more detail.
Similarly, agencies and accountants can read our guide to multi-client reporting.
Likewise, operations teams on Odoo can start with our guide to Odoo in Power BI.
What makes a good KPI
First of all, a good KPI supports a decision. If the number moved, someone would act on it. It also has a written formula, one owner, a target and a source system you can trust.
Take days sales outstanding (DSO) as an example. It measures how long customers take to pay. The formula is average receivables divided by revenue, times the days in the period. The finance lead owns it, the target might be 45 days, and the numbers come from the accounting system. Because everyone reads it the same way, it starts the right conversation.
For finance teams in particular, our guide to financial close automation shows how to get month-end numbers faster.
How to create a KPI dashboard in 7 steps
1. Start with the decisions
Before you pick any numbers, write down the decisions the dashboard should support. For instance: “Do we need to chase overdue invoices this week?” Each decision then points to one or two KPIs.
2. Choose five to ten KPIs
Next, keep the list short. Every extra number makes the important ones harder to see. If a KPI does not change any decision, leave it out or move it to a detailed report.
3. Define each KPI in writing
Then write a one-line definition for every KPI, so that finance and sales calculate it the same way. A simple table works well:
4. Get the data in one place
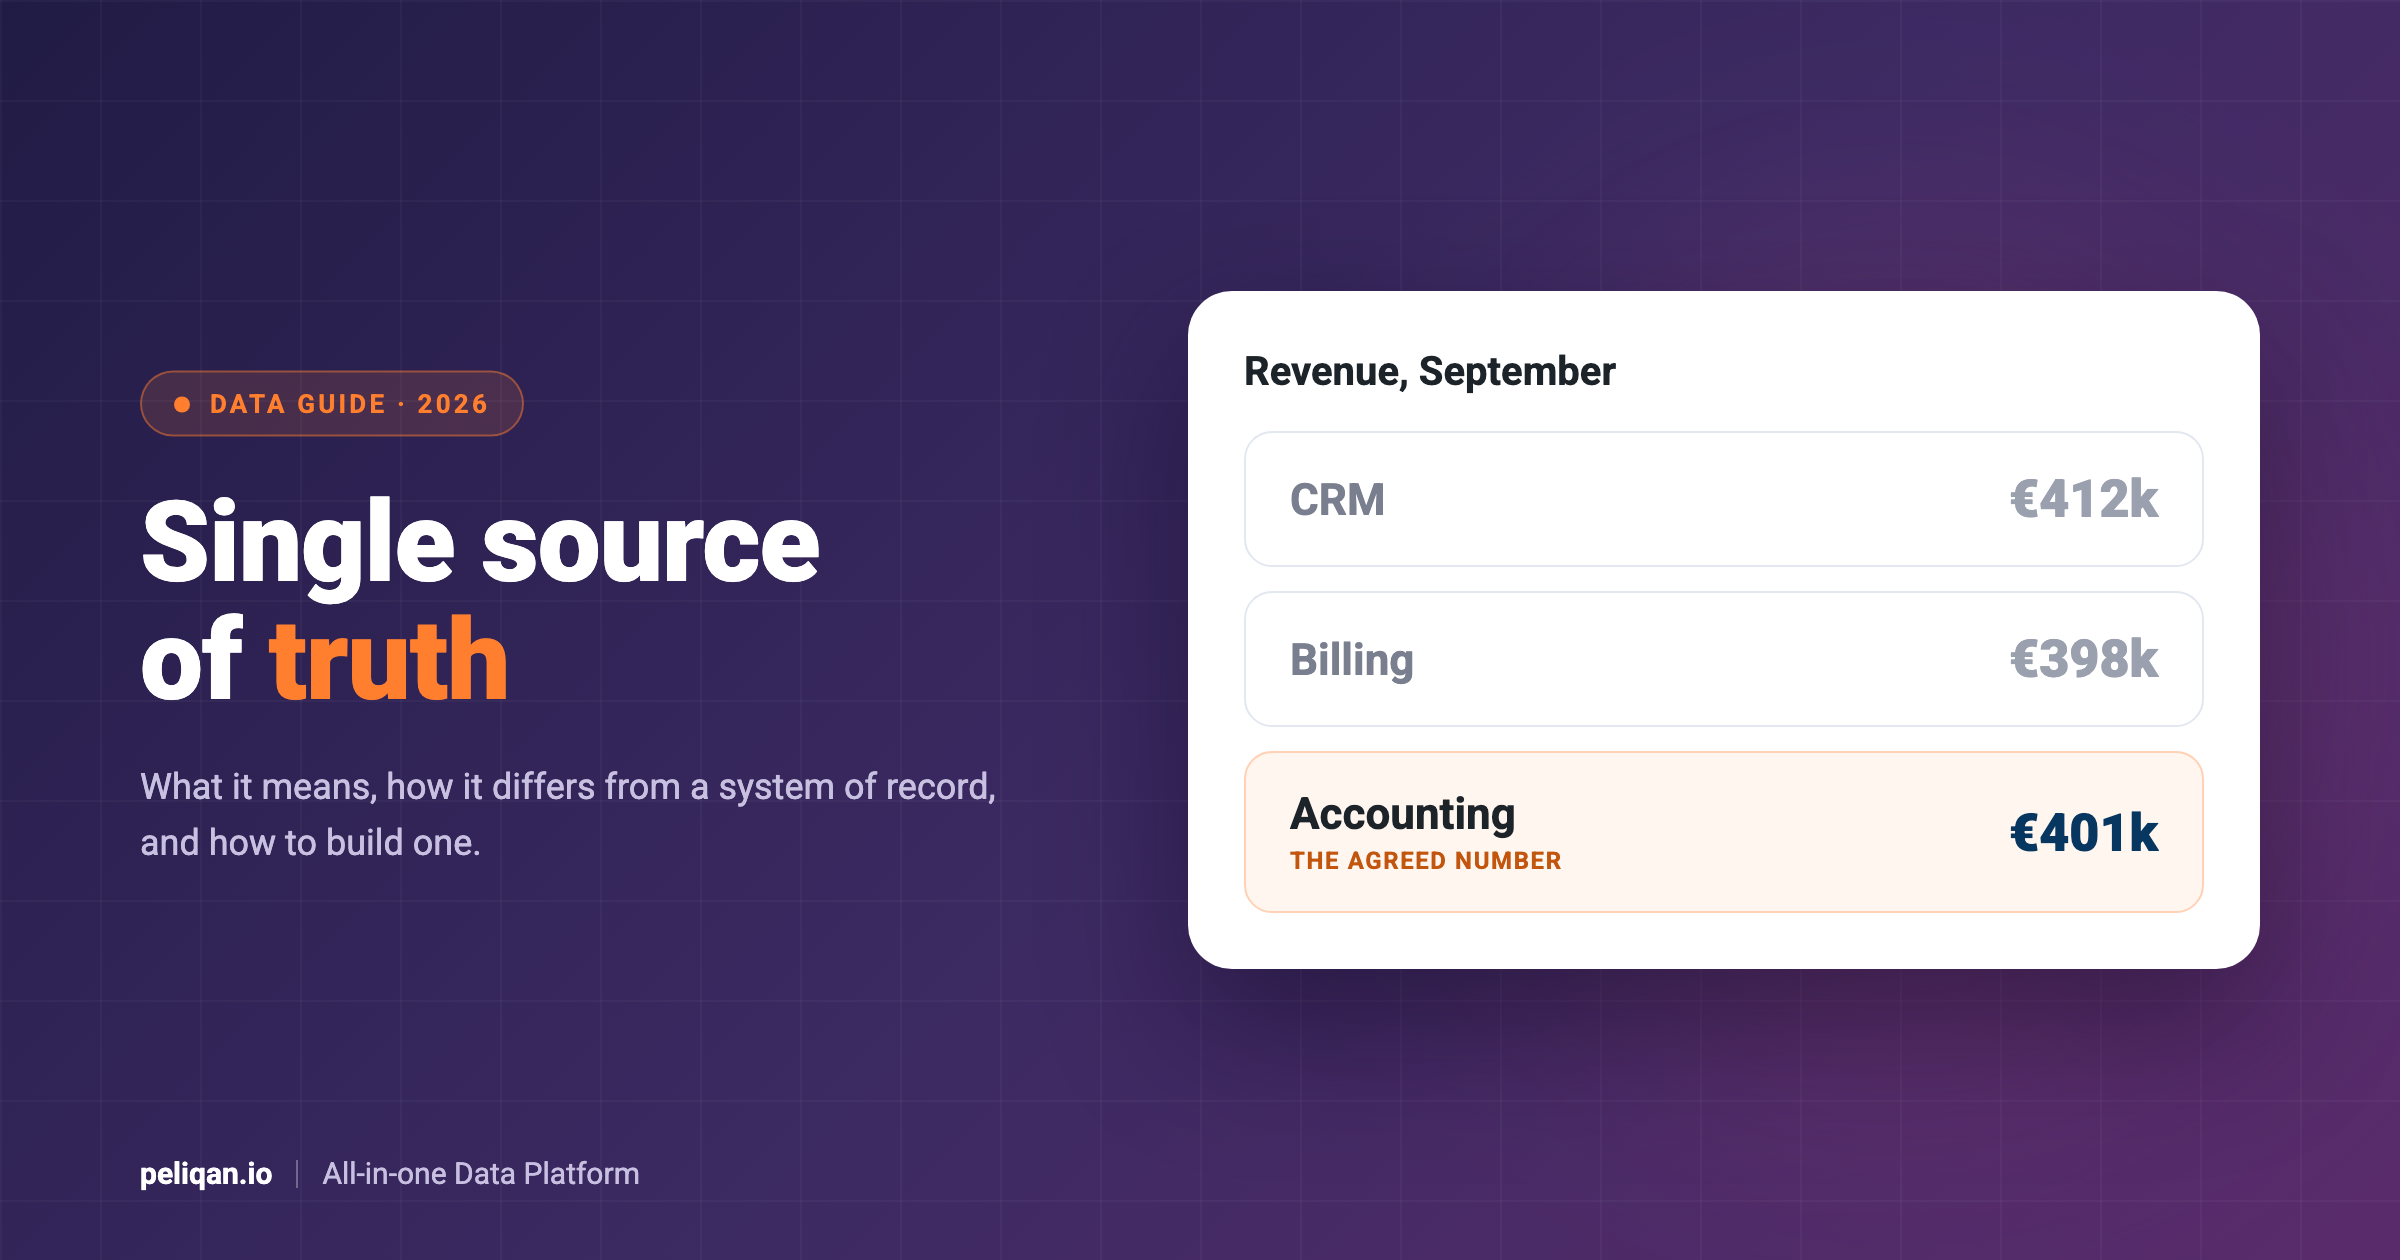
After that, bring the data together. For one KPI from one app, the app’s own reports may be enough. But most dashboards combine apps, such as revenue from accounting with deals from the CRM. In that case, copy the data into one data warehouse on a schedule. That way, every KPI reads from the same copy. Our guide to a single source of truth explains why this matters.
In addition, our data warehouse examples show what such a setup looks like in different industries.
5. Check the numbers against the source
Before anyone sees the dashboard, compare a few numbers with the source app. For example, does last month’s revenue match the accounting system to the cent? If not, find out why first. A dashboard that is wrong once loses trust for a long time.
6. Design the layout
Then put the most important KPIs at the top left, where people look first. Next, show each number with its target and a small trend. Use colour only to flag what needs action. Also, keep labels in plain words, and add the definition on hover or in a short note.
7. Set the refresh and alerts
Finally, decide how fresh each number must be. Cash and stock may need daily or hourly updates, while margin is fine monthly. In addition, set alerts for the few thresholds that matter. That way, nobody has to open the dashboard to notice a problem.
Why KPI dashboards go wrong
Most failed dashboards fail on data, not design. The most common cause is numbers that do not match the source system. For example, the dashboard shows one revenue figure and the accounting system shows another. After that, people stop trusting it and go back to their own spreadsheets.
Manual exports are the second cause. For instance, if someone pastes three exports together every Monday, the dashboard is often late. Sooner or later, that person also misses a step. Similarly, KPIs without written definitions lead to arguments, because each team calculates them a little differently.
Too many KPIs is the third cause, because when everything is on the screen, nothing stands out. Finally, a dashboard that nobody owns slowly goes stale. So give every dashboard an owner who checks it, fixes it and removes what is no longer used.
How to create a KPI dashboard in Excel
Excel is still the most common place for a first KPI dashboard, and it works well for a small team. First, put the raw data on its own sheet. Then calculate each KPI on a second sheet with simple formulas. Finally, build the charts and the summary on a third sheet. Conditional formatting can colour each number against its target.
However, the weak spot is getting the data in. Exporting from each app and pasting it into Excel every week is slow and easy to get wrong. One alternative is to pull the data straight from a data warehouse into Excel.
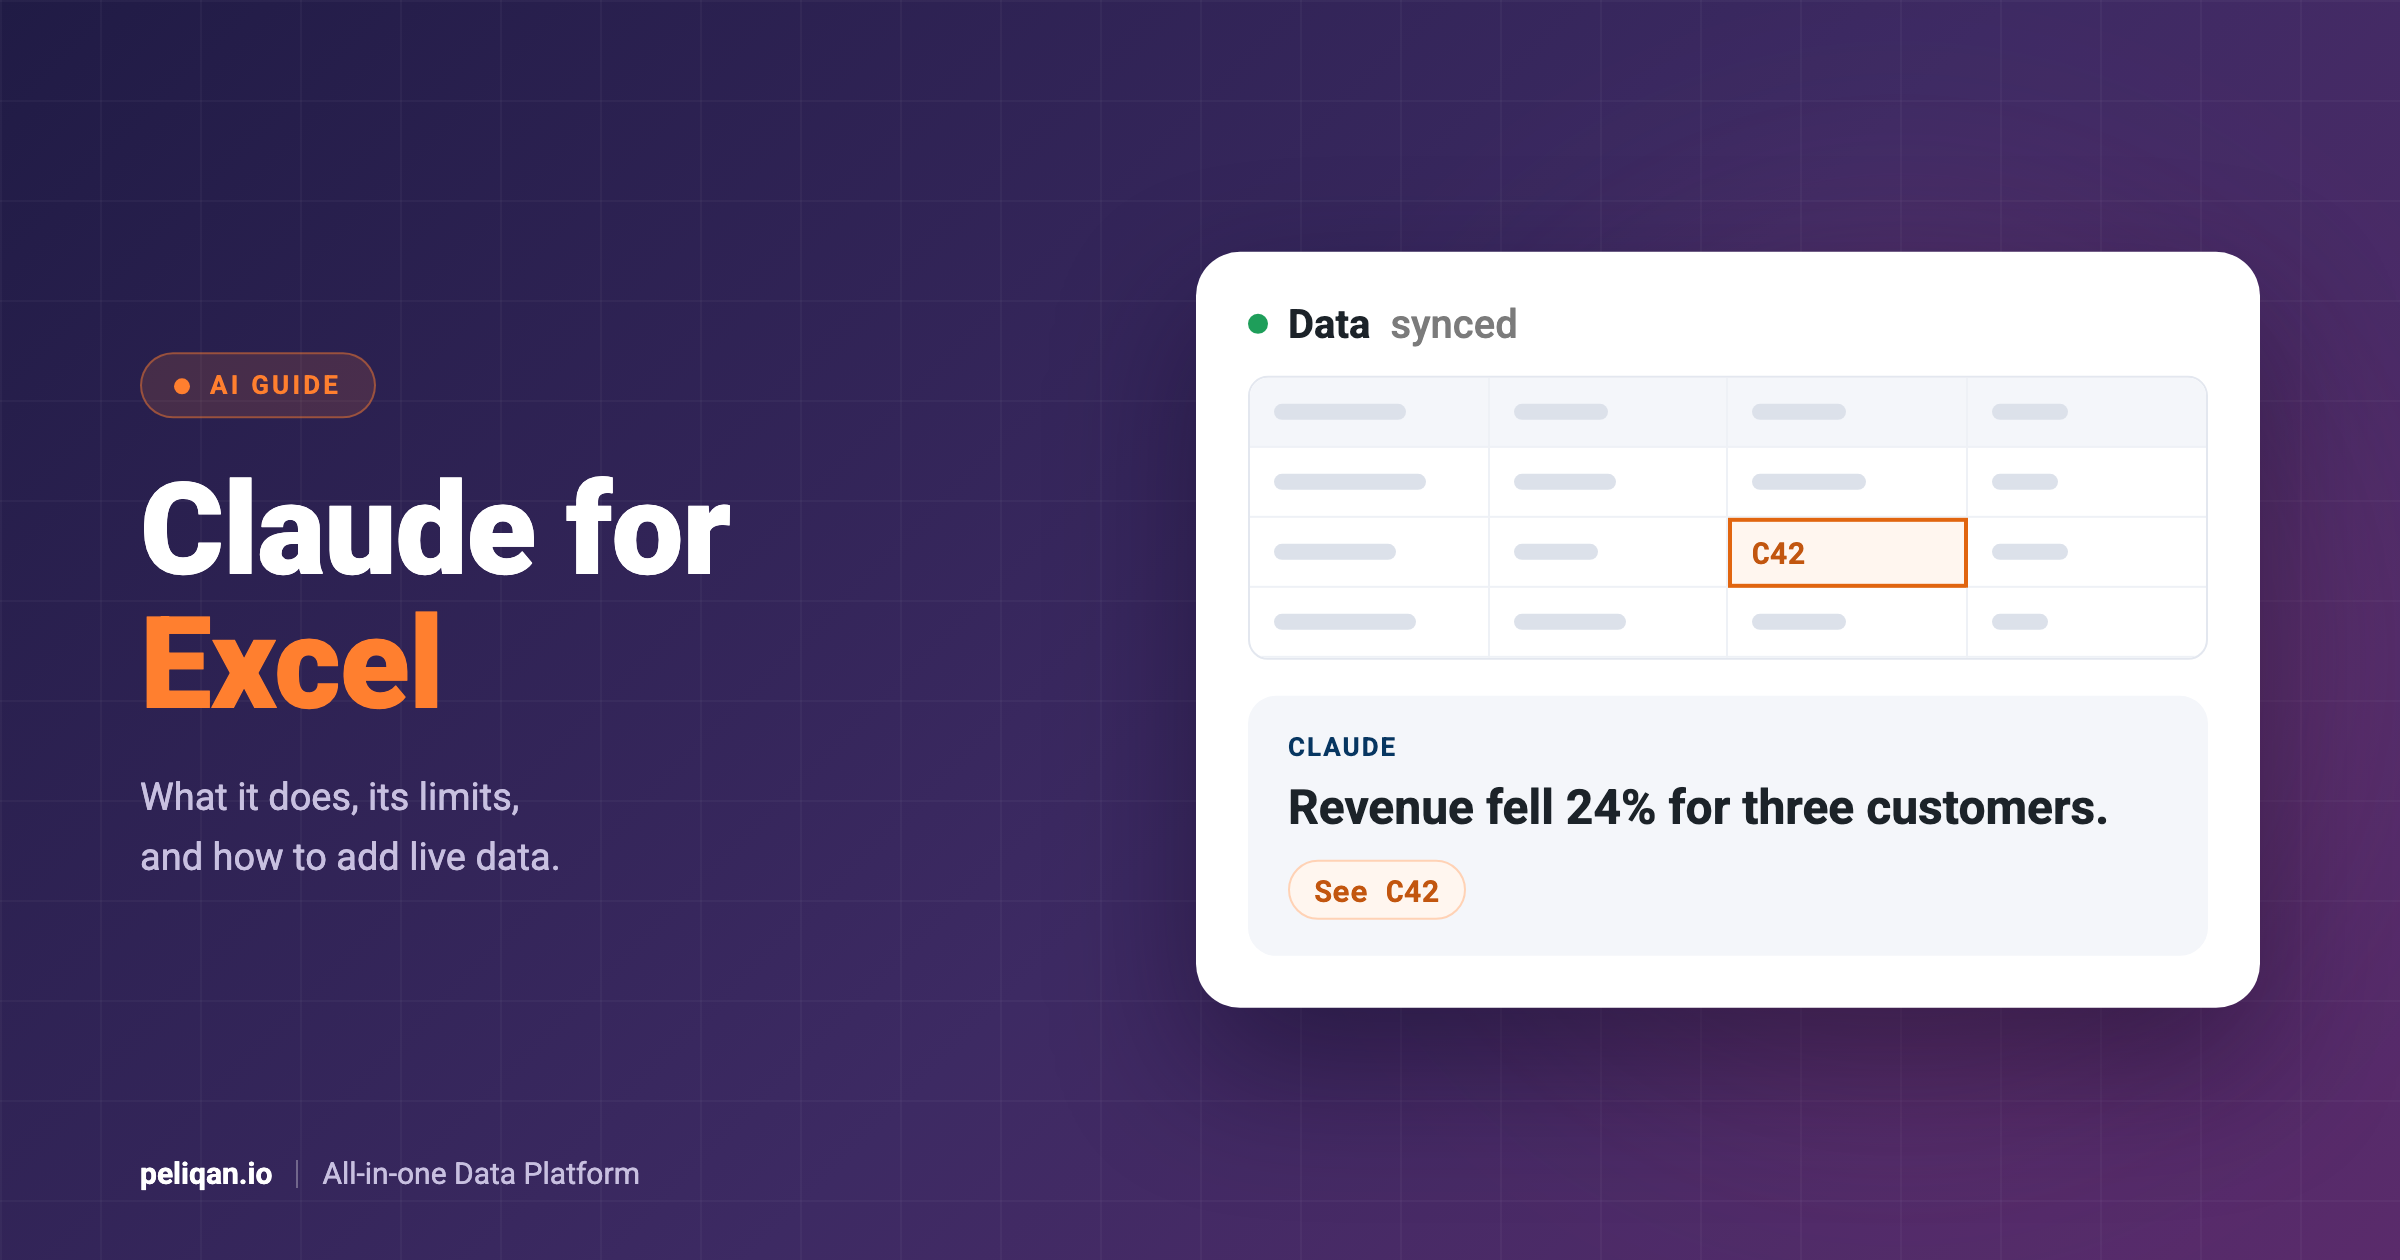
For example, the Peliqan Excel add-in pulls data from Peliqan tables and queries into a sheet. It works in Excel on Windows, Mac and the web, and you click “Sync data” to refresh it. The add-in overwrites its own sheet on every sync. So keep that sheet untouched, and build your KPIs on other sheets with lookups.
KPI dashboard tools
Broadly, there are four kinds of tools for building a KPI dashboard. Each one, however, suits a different team and budget.
Whichever tool you choose, however, the data question stays the same. A BI tool such as Power BI makes clear charts, but only from data that is already clean and joined. Our guide to HubSpot in Power BI shows what that takes for a CRM.
Likewise, our guide to Exact Online in Power BI covers the same steps for accounting data.
Above all, the goal is that people can answer their own questions without waiting for an analyst. Our guide to self-service analytics explains how to set that up.
Feeding a KPI dashboard from your apps with Peliqan
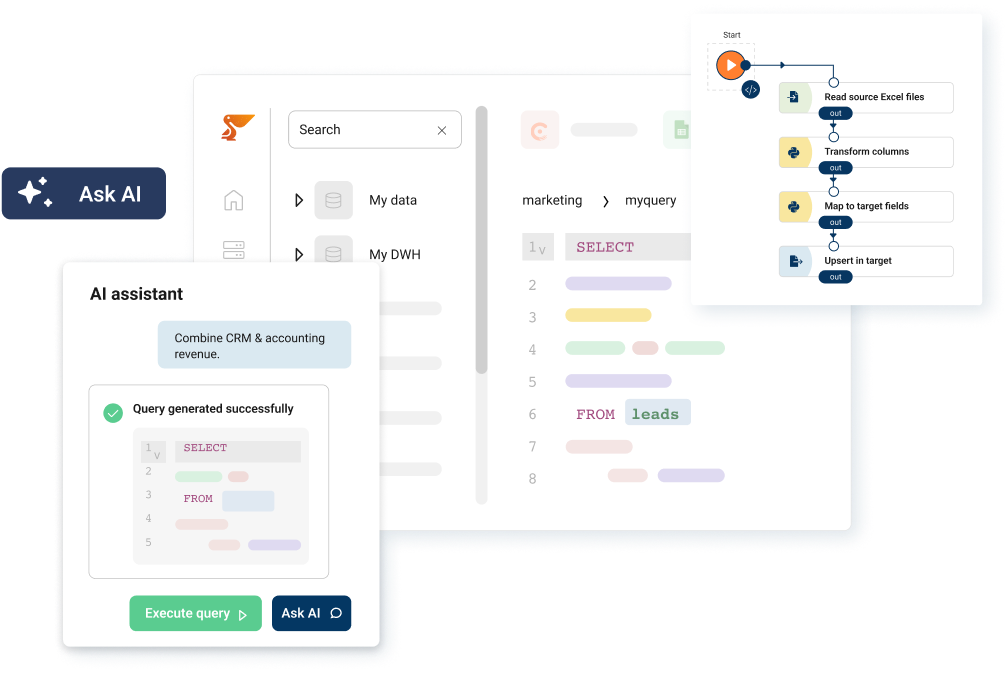
Peliqan takes care of the data side. It connects to 300+ business apps, such as your CRM, accounting software and webshop. Then it syncs their data into a built-in data warehouse on a schedule. After that, you define each KPI once, in SQL, so every dashboard and report uses the same rule.
Show it where your team already looks
From there, you can show the KPIs in the tool your team prefers. For instance, Power BI, Tableau and Looker connect directly to the data warehouse. So does Metabase, which you can deploy in one click from the Peliqan Marketplace. Excel users, meanwhile, can use the add-in described above.
You can also build the dashboard itself as a Peliqan data app. In addition, Peliqan can send scheduled reports by email, Slack or Microsoft Teams. It can also alert a team when a number crosses a threshold.
Build it with AI, and check every number
The peliqan-dashboard skill lets Claude build the dashboard for you. For example, you can ask it to rebuild an existing Power BI or Excel report, or to start from a list of KPIs. According to Peliqan’s skills documentation, it first sets up the data model. Then it verifies every number on real data before it builds and documents the dashboard.
If you are new to this, our guide to Claude skills explains how skills work.
A real example
CIC Hospitality, for example, used Peliqan to bring data from more than 50 sources together for board-level reporting. As a result, the team no longer consolidates spreadsheets by hand and saves around 40 hours a month. You can read the case studies for more.
Conclusion
A KPI dashboard is only as good as the numbers behind it. So start with the decisions you need to make, and pick five to ten KPIs. Then write down exactly how to calculate each one. Next, get the data from your apps into one place and check it against the source. Only after that, work on the design.
For a small team, a spreadsheet is a fine first version. However, once the data comes from several apps, a data warehouse with your KPIs defined once saves time and arguments. To see which apps you can connect, browse the Peliqan connectors.