


Exact Online holds your general ledger, your debtor balances, your project hours, and your VAT records – but the moment someone asks for a live Power BI dashboard that pulls all of that together across multiple divisions, the real complexity begins. Rate limit errors break overnight refreshes, the native Power BI connector requires an always-on gateway machine and a Premium subscription, and payment status is not even directly available on the invoice object.
This guide covers every connection method, what each one actually costs in setup time and maintenance, and how to build a financial reporting model in Power BI that holds up as your business grows.
What is Exact Online?
Exact Online is the leading cloud-based accounting and ERP platform for small and mid-sized businesses in the Benelux and Nordics, with over 400,000 companies using it across the Netherlands, Belgium, Germany, the United Kingdom, and beyond. Founded in 1984 and headquartered in Delft, the Netherlands, Exact has built one of the most complete financial management platforms for SMBs in Europe – combining accounting, invoicing, CRM, projects, payroll, and HR in a single multi-division cloud environment.
Exact Online at a glance
What makes Exact Online particularly powerful – and particularly challenging for reporting – is its depth. A mid-sized Dutch company might run three divisions inside one account, with separate ledgers, separate debtor and creditor lists, and separate payroll runs, all linked through a shared chart of accounts. Reporting across that structure in Power BI is not a simple connector problem. It is a data modelling problem that starts long before you open Power BI Desktop. Businesses that also use Teamleader alongside Exact Online for CRM and project management face an additional layer – linking revenue records across both systems, as covered in our Teamleader Focus Power BI guide.
Why connecting Exact Online to Power BI is harder than it looks
Exact Online’s API is well-documented and genuinely comprehensive – but several structural realities make a direct Power BI connection less straightforward than it appears at first.
Six integration challenges to plan for
The real cost of month-end reporting on manual exports
Most finance teams at Exact Online customers default to a familiar pattern: export the P&L to Excel at month-end, copy debtor aging into a separate tab, paste in the project budget overview, and spend two days building the management pack. Forrester Research found that knowledge workers spend an average of 12 hours per week gathering and preparing data. For a three-person finance team, that is nearly 1,800 hours per year spent on data assembly rather than analysis – and that is before accounting for the version control chaos that comes with shared Excel files.
The compounding cost of stale financial data
5 ways to connect Exact Online to Power BI
1. Manual CSV and Excel export
Exact Online allows you to export most financial entities – P&L summaries, balance sheets, debtor lists, invoice overviews – as CSV or Excel files from the interface. Import these into Power BI Desktop, build your report, and publish to the Power BI service. For a one-off board pack or an annual analysis, this works.
The limit is obvious: every refresh is a manual process. Power BI’s scheduled refresh cannot reach a file on someone’s desktop. This approach breaks entirely when you need to join data across multiple exports – debtors from one file, GL transactions from another, projects from a third – because every join is manual and every format change in the Exact Online export breaks your Power Query steps. Best for: one-off analysis, ad-hoc board presentations, or teams with a reporting cadence of monthly or less.
2. Exact Online native Power BI Premium connector
Microsoft and Exact Online publish a certified Power Query connector for Exact Online Premium, listed on the official Microsoft Power Query connectors page. It connects Power BI Desktop directly to Exact Online through an ODBC layer and supports scheduled refresh through an on-premises data gateway.
The operational requirements are significant: you need an Exact Online Premium subscription, an always-on Windows machine running the on-premises gateway, ODBC Connector version 18 installed on that machine, and your gateway machine’s IP address whitelisted in Exact Online’s settings. If the gateway machine reboots, is taken offline, or has its IP change, every scheduled refresh fails until the issue is resolved. There is also a documented limitation with dataflows in Power BI Premium workspaces when connectors require a gateway. For organisations without a dedicated IT resource to maintain the gateway, this quickly becomes a maintenance liability. Best for: organisations already on Exact Online Premium with a managed, always-on Windows server and IT support to maintain the gateway.
3. Direct API connector (Invantive Cloud)
Invantive Cloud offers one of the most established third-party Exact Online connectors for Power BI, exposing over 1,200 Exact Online tables through Power Query via an ODBC driver. The connector handles OAuth token refresh and pagination automatically and is available with a free tier. It is widely used in the Netherlands and Belgium for Exact Online reporting.
The architectural constraint is that Invantive operates as a live API pass-through: every Power BI refresh hits the Exact Online API in real time. This means the 300 req/min rate limit applies directly to every dashboard refresh. In a workspace with multiple reports refreshing on a schedule, throttling errors are common. Large historical datasets – multi-year GL transaction histories or full debtor aging across three divisions – make refreshes slow and unreliable. There is also no persistent historical store: if Exact Online data changes retroactively (a common occurrence with VAT corrections and period adjustments), the change is reflected immediately with no audit trail of the previous state. Details are at Invantive’s Exact Online Power BI connector page. Best for: single-division Exact Online accounts with modest transaction volumes and teams comfortable managing a third-party ODBC driver.
4. iPaaS and ETL middleware (CData, Dataddo, Make)
Tools like CData, Dataddo, and Make can extract data from the Exact Online API on a schedule and load it into a destination – a Google Sheet, a SQL database, or a cloud storage bucket – which Power BI then reads. This adds a buffer layer between the live API and Power BI, which partially addresses the rate limit problem by batching API calls on the middleware side.
The challenge is depth and join complexity. Most iPaaS tools handle entity-by-entity extraction well but struggle with the multi-step joins that financial reporting requires – resolving payment status across invoices and bank transactions, consolidating GL data across divisions, or linking project hours to their invoice lines. Each of these joins needs to be built and maintained in the middleware layer. The data joining guide explains why warehouse-level SQL is a more maintainable approach to these cross-entity joins than ETL pipeline logic. Best for: teams already using CData or Dataddo for other integrations, or those syncing a single Exact Online entity to an existing destination.
5. Warehouse-first platform
A warehouse-first platform syncs all Exact Online data – GL accounts, transactions, invoices, debtors, creditors, projects, payroll – into a persistent data warehouse on a scheduled cadence. Power BI connects to the warehouse, not to the live Exact Online API. This eliminates the rate limit problem entirely: API calls happen during the sync window, not during report refresh. Dashboard queries hit a database, not a paginated REST API.
This approach handles the hard problems automatically: multi-division consolidation in a single query, payment status resolution via pre-built joins in the warehouse, full historical data accumulation with an audit trail of every state, and no gateway machine to maintain. For organisations combining Exact Online with other tools – Teamleader for CRM, Yuki for accounting, HubSpot for marketing – the warehouse becomes the single source of truth that all reporting reads from. The connect-to-data documentation covers how this pipeline is set up for Exact Online in practice. Best for: multi-division organisations, finance teams needing consolidated reporting across Exact Online and other tools, or anyone who has hit rate limit errors with a direct connector.
Comparison: all 5 methods side by side
| Method | Setup time | Multi-division | Gateway required | Historical data | Rate limit risk | Data warehouse included | Maintenance burden |
|---|---|---|---|---|---|---|---|
| Manual CSV export | Minutes | Manual per division | No | Export scope only | None | No | Very high (manual) |
| Native Premium connector | 1-3 days | Limited | Yes (always-on) | Full via API | Medium | No | High (gateway upkeep) |
| Invantive Cloud connector | 1-2 days | Partial | No | Full via live API | High (live API per refresh) | No | Medium |
| iPaaS / ETL middleware | Days to weeks | Partial | No | Partial (event-driven) | Low (batched) | No | High (custom pipeline) |
| Warehouse-first platform | Hours | Full (built-in) | No | Full historical | None (sync window) | Yes (built-in) | Low |
Exact Online API data: what’s available for Power BI reporting
The Exact Online REST API covers all major business domains through paginated OData-compatible endpoints. Each entity is scoped to a division – meaning a three-division account produces three separate data sets for every entity type below. The Peliqan Exact Online getting started guide covers how multi-division data lands in the warehouse as unified, queryable tables.
| API entity | Key fields | Power BI use case |
|---|---|---|
| GL accounts | Code, Description, Type, BalanceSide, CostCenter, Division | Chart of accounts dimension, P&L structure, cost center hierarchy |
| GL transactions | Date, Amount, GLAccount, Division, FinancialYear, FinancialPeriod, Description | P&L by period, balance sheet snapshots, budget vs. actuals |
| Sales invoices | InvoiceNumber, InvoiceTo, InvoiceDate, AmountDC, Currency, YourRef, Division | Revenue tracking, invoice aging, sales by customer |
| Receivables (debtors) | AccountName, OutstandingAmount, DueDate, InvoiceNumber, Division | Debtor aging analysis, DSO calculation, overdue alerts |
| Purchase invoices | SupplierName, Amount, EntryDate, DueDate, PaymentCondition, Division | Creditor aging, cash flow forecasting, supplier spend analysis |
| Bank transactions | Date, Amount, Description, GLAccount, MatchStatus, Division | Payment status resolution, bank reconciliation, cash position |
| Projects | ProjectCode, Description, Budget, BudgetedHours, StartDate, EndDate, Division | Project margin, budget vs. actuals, delivery timeline |
| Hours (time entries) | Employee, Project, Activity, Hours, Date, Billable, Division | Billability rate, project cost vs. revenue, team utilisation |
| Accounts (relations) | AccountName, VATNumber, Country, IsSupplier, IsCustomer, Division | Customer segmentation, geographic breakdown, supplier classification |
| Employees | Name, Department, StartDate, Division, CostCenter | Headcount reporting, cost centre allocation, HR analytics |
The key insight from this data model is that payment status requires a three-way join: sales invoice → receivables outstanding → bank transactions matched. None of these tables surfaces a simple “paid” boolean. In a warehouse-first setup, this join is written once as a SQL transformation, materialised as a table, and updated automatically on every sync. In a direct API connector, it has to be re-executed on every Power BI refresh – at significant API cost. The Peliqan Exact Online connector page covers how this join is handled automatically in the pipeline.
How to choose the right connection method
Decision framework
Power BI modeling tips for Exact Online data
Design a multi-division model from the start
If your Exact Online account contains multiple divisions, design your Power BI model to handle them from day one rather than retrofitting later. There are two approaches: the union pattern (stack all divisions into a single fact table with a Division column as a filter dimension) or the separate dataset pattern (one Power BI dataset per division, connected through a shared dimension model). The union pattern is simpler to maintain for most SMBs and works well for up to five or six divisions. The data transformations guide covers how to write the SQL UNION ALL queries in Peliqan that pre-consolidate multi-division GL data before it reaches Power BI.
Resolve payment status with a pre-built join
Build the payment status join once, materialise it as a view or table in your warehouse, and connect Power BI to that output rather than to the raw invoice and bank transaction tables. The join logic combines SalesInvoices with the Receivables outstanding table and filters for MatchStatus = “Matched” in bank transactions. Running this join at query time inside Power BI is expensive – both in API cost and in report load time. Running it once during the sync cycle and storing the result is the correct approach. The SQL on anything documentation shows how to materialise this pattern as a scheduled transformation in Peliqan.
Build your GL hierarchy as a dimension table
Exact Online’s chart of accounts has a hierarchical structure: account groups contain ledger accounts, which map to cost centres and cost units. In Power BI, you want this as a proper dimension table – not as repeated columns on every GL transaction row. Extract the GLAccounts entity, build a parent-child hierarchy using Power BI’s PATH function, and link it to GL transactions via the GLAccount key. This lets your P&L report roll up from individual accounts to account groups to total revenue or total cost in a single visual, without hardcoding account numbers into measures. For teams integrating a similar GL hierarchy from Odoo, the same approach applies – as covered in our Odoo Power BI guide.
Use proper date tables for period-based financial reporting
Exact Online organises transactions into financial years and financial periods, which do not always align with calendar months – some companies run a 13-period year or a fiscal year that starts in April. Build a date dimension that maps calendar dates to financial periods, financial years, and comparative periods (prior year, prior quarter). Link it to GL transaction dates, invoice dates, and due dates. Without this, every year-on-year comparison measure in DAX becomes a hardcoded workaround that breaks at year-end. The materialise tables documentation covers how to build and schedule this dimension in Peliqan so it is always current.
Monitor data freshness and flag financial anomalies automatically
Once your Exact Online data lands in a warehouse, you can run automated SQL or Python checks alongside your Power BI reports – flagging invoices overdue by more than 60 days, GL transactions posted to unexpected accounts, project hours logged after a project close date, or bank reconciliation gaps. These checks run on a schedule and trigger Slack or email alerts before anyone opens a dashboard. Power BI becomes the exploration layer; the operational alerts happen automatically. The data quality monitoring documentation covers how to build these checks alongside an Exact Online pipeline.
How Peliqan handles Exact Online integration
What Peliqan does out of the box for Exact Online
The similar connector setup patterns apply across Peliqan’s 250+ connectors, and Exact Online sets up in hours, not days. OAuth registration is handled through Peliqan’s interface – you do not need to register a private app in the Exact Online developer portal unless your policy requires it. All divisions are detected automatically at connection time and begin syncing to the built-in warehouse immediately.
For teams exploring AI on top of their financial data, the Peliqan AI page for Exact Online covers the full MCP server setup, Text-to-SQL on your GL and debtor data, and RAG with embeddings for document-heavy workflows like contract matching and invoice classification. The same pipeline that feeds Power BI also feeds your AI layer – there is no separate setup for analytics versus AI.
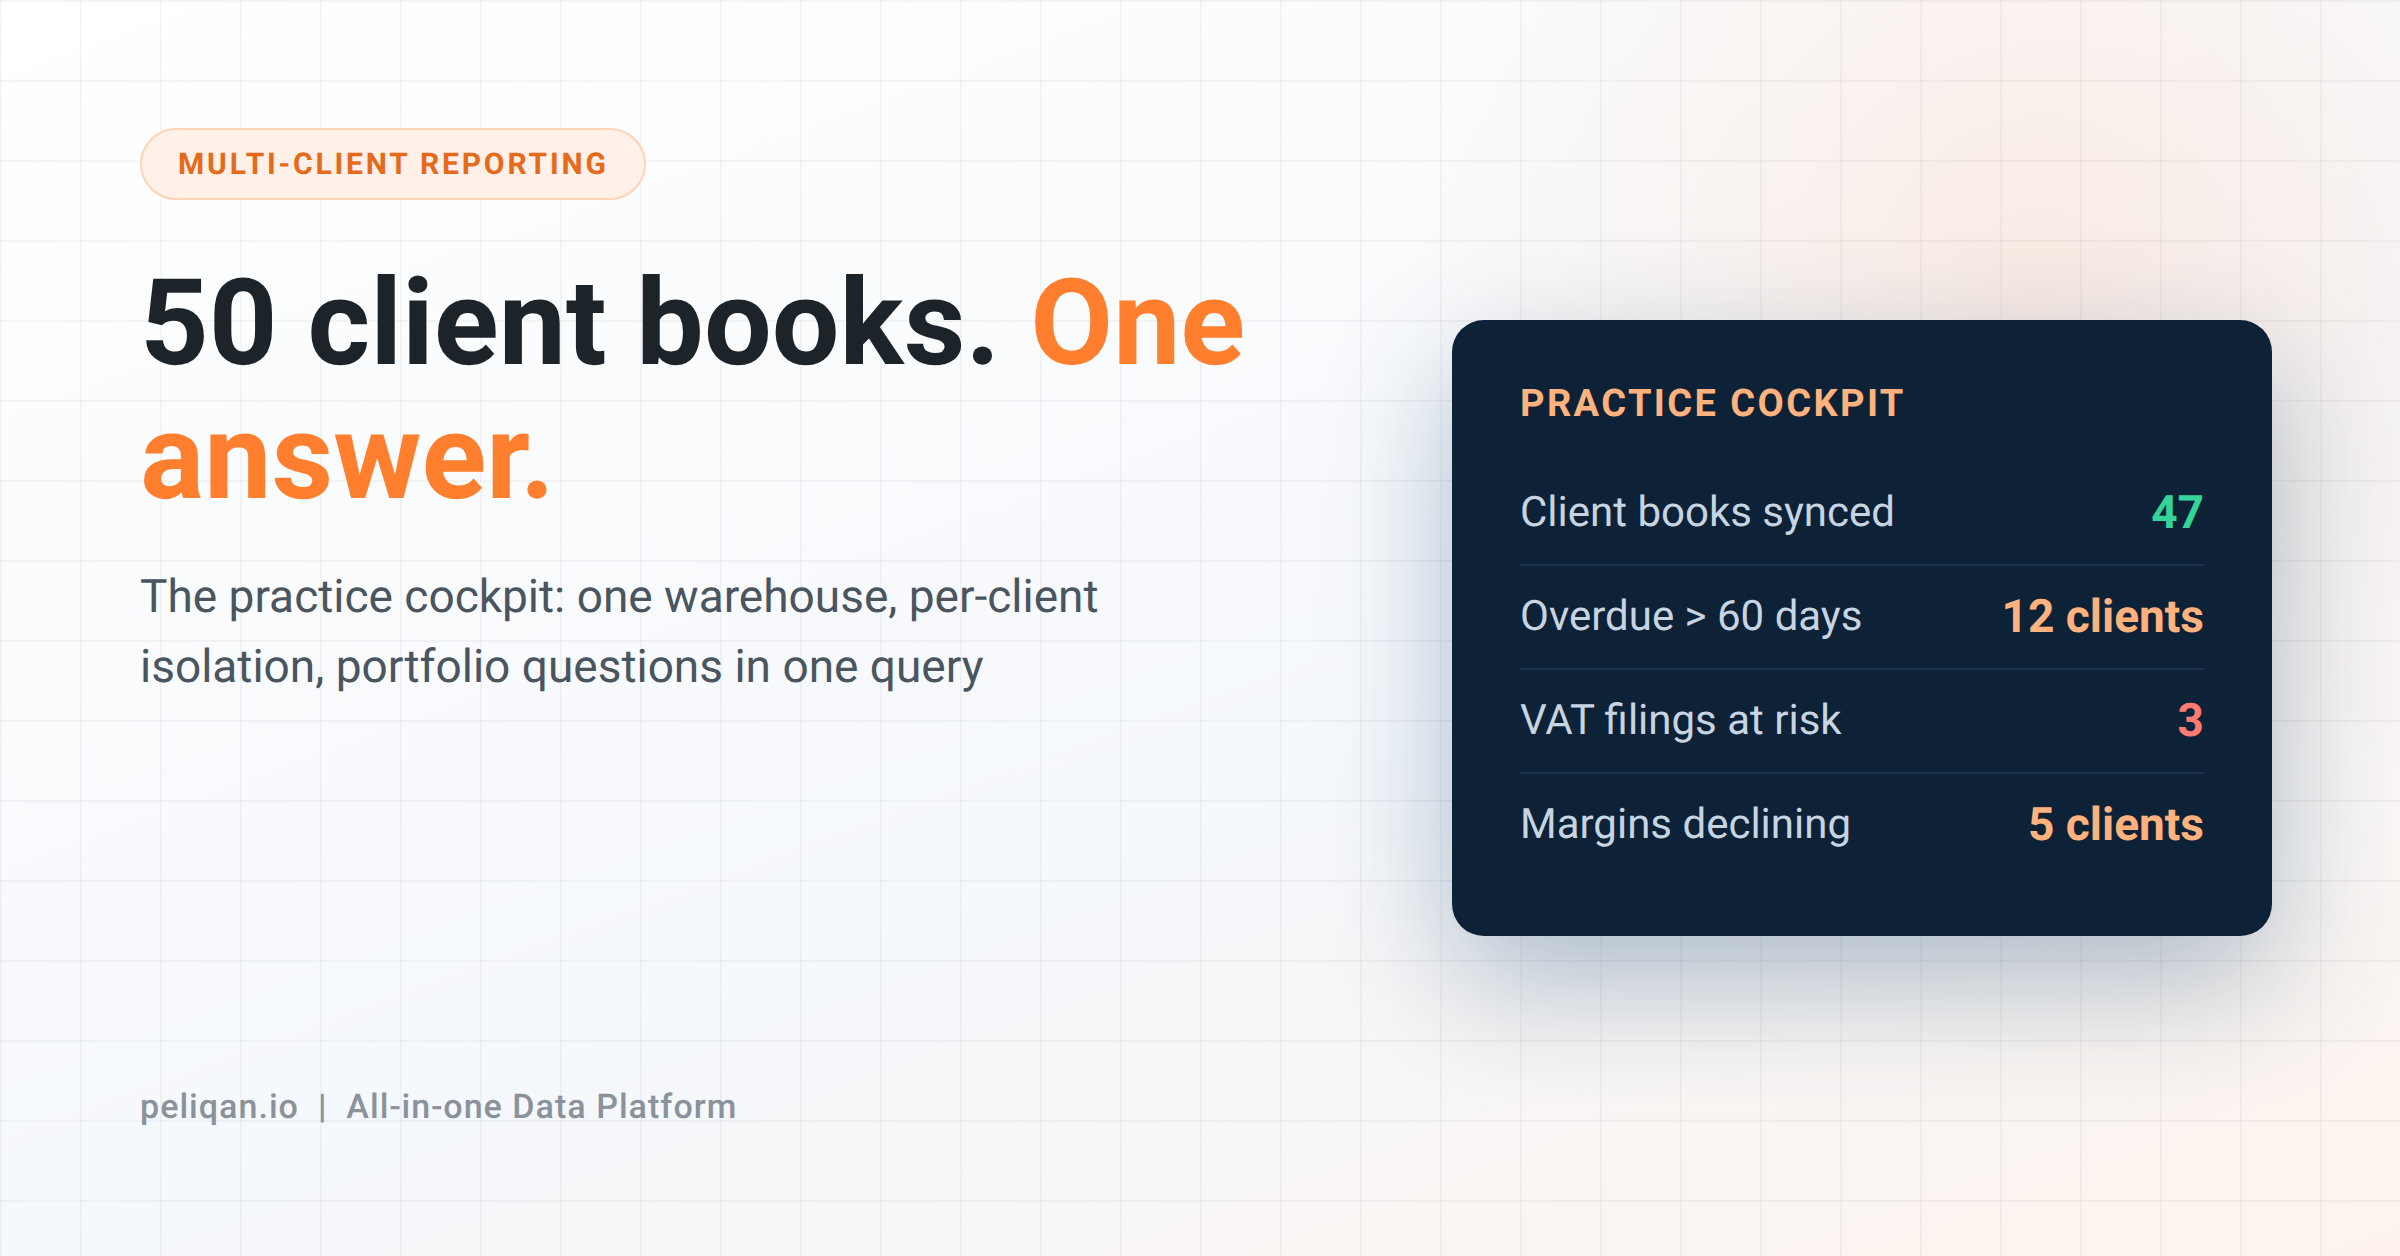
Accounting practices managing Exact Online reporting for multiple client companies benefit from Peliqan’s multi-customer management and white-label capabilities. Each client environment is isolated, with its own Exact Online connection and its own warehouse schema. The consultancy manages all pipelines from a single Peliqan account with multi-customer management – without rebuilding the same Exact Online pipeline from scratch for each engagement.
Firms already using AdminPulse or Yuki alongside Exact Online will find the same multi-connector architecture covered in our accounting practice reporting guide.
Peliqan is SOC 2 Type II certified and ISO 27001 compliant. For finance teams handling sensitive GL data, VAT records, and payroll information under GDPR, that matters. Data residency options are available for organisations with EU data localisation requirements. Pricing is fixed per month with no per-connector fees, no per-row charges, and no separate cost for the built-in warehouse. The reverse ETL documentation covers how to activate Exact Online data downstream – into Teamleader, into HubSpot, or into your own applications – once the warehouse pipeline is running.
Conclusion
Exact Online is one of the most data-rich platforms an SMB finance team can work with – but that richness is also what makes direct Power BI connections difficult. Rate limits, the division architecture, the payment status join problem, and the gateway requirements of the native connector are not edge cases. They are the norm for any organisation trying to build reliable, automated financial dashboards at scale.
The right architecture depends on your starting point. A single-division company with modest reporting needs can get value from the native connector or Invantive. Any organisation with multiple divisions, a need for payment status analytics, or a requirement to combine Exact Online with other data sources will save significant time and maintenance effort by moving to a warehouse-first approach from the start. The same lesson holds across the Benelux SaaS ecosystem – whether you are connecting AFAS, Shopify, or Teamleader, the Shopify Power BI guide shows how the same warehouse-first architecture solves the same class of problems across different source systems.
For finance teams ready to move beyond manual exports and rate limit errors, the Peliqan Power BI and Exact Online page is the right starting point. The pipeline sets up in hours and multi-division data is available immediately.
The same warehouse that feeds your Power BI dashboards can power AI agents on your financial data without any additional infrastructure.