Connect to your favorite BI tools like Power BI, Tableau, Looker, and Metabase – or build custom reports with low-code Python and distribute via email, Slack, and MS Teams.
Connect to leading BI tools or build custom reports
Connect your favorite BI tool
Direct BI connectivity
Connect Power BI, Tableau, Looker, Metabase, and other BI tools directly to Peliqan’s built-in data warehouse or your own DWH (Snowflake, BigQuery, Fabric, Redshift).
SQL-ready data
Write SQL queries to prepare and transform data for your BI dashboards. Clean, join, and aggregate data from 250+ sources before it reaches your BI tool.
Real-time or scheduled syncs
Keep your BI dashboards up-to-date with real-time data access or scheduled ETL pipelines that refresh automatically.
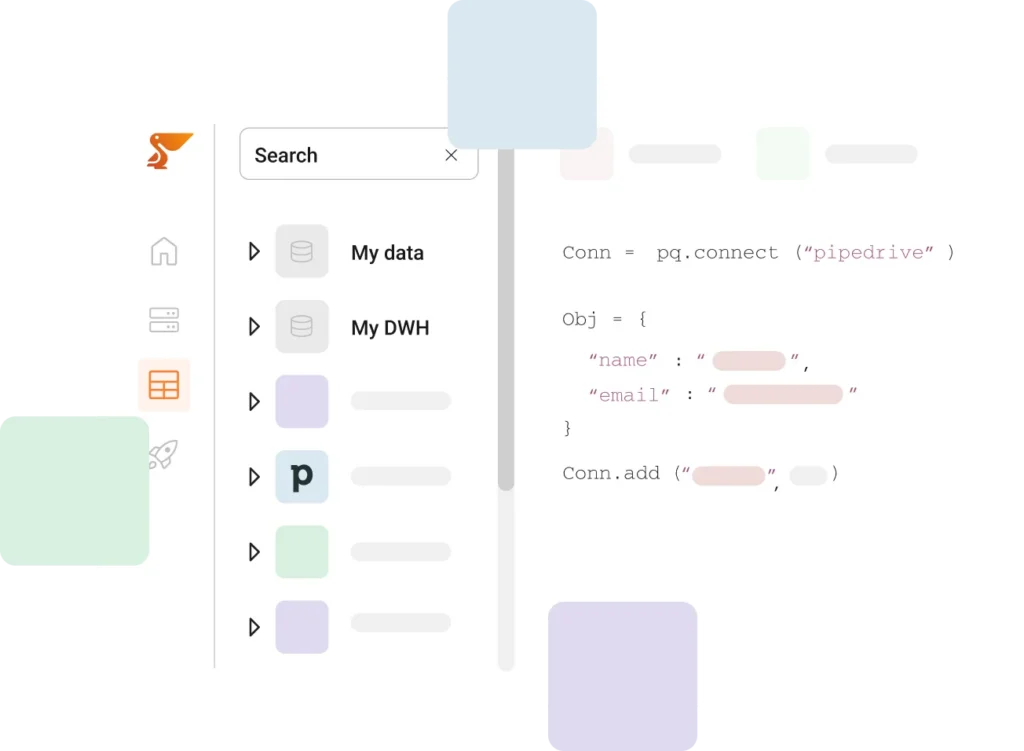
Build reports with low-code Python
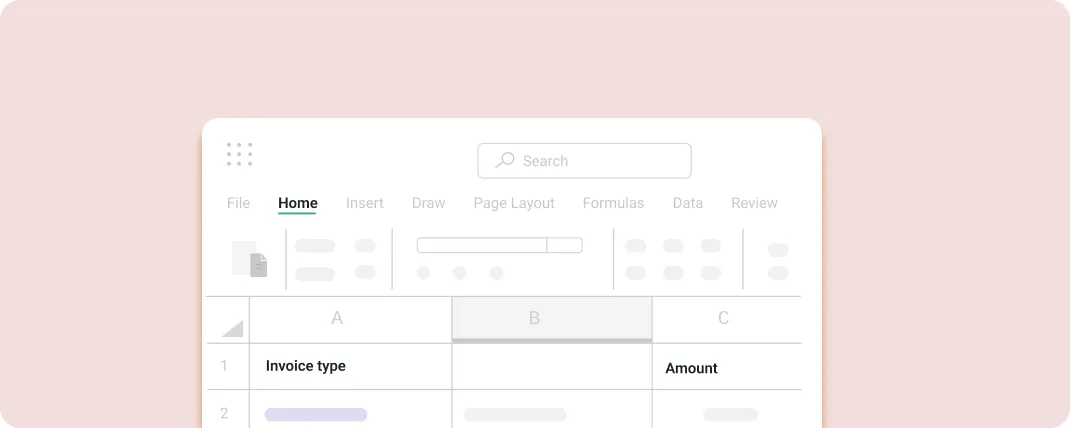
Excel, Google Sheets & PDF
Build personalized reports using low-code Python. Sync data into spreadsheets or generate PDF reports with scheduled updates.
Distribute at scale
Send reports via email, Slack, MS Teams, or cloud storage (OneDrive, SharePoint, Google Drive). Automate distribution based on department, role, or region.
Two-way data flows
Enable data entry in Excel and Google Sheets (e.g., sales targets, forecasts). Write back updates directly into your data warehouse for closed-loop workflows.
From raw data to actionable insights in minutes
Peliqan brings ETL pipelines, data transformations, and BI connectivity together in one integrated platform. Connect 250+ data sources, transform with SQL and low-code Python, and activate in your favorite BI tool.
How does it work?
Whether you’re building dashboards in Power BI or custom reports in Excel, Peliqan handles the data pipeline so you can focus on insights.
Step 1: Connect your BI tool
Connect Power BI, Tableau, Looker, Metabase, or any SQL-compatible BI platform with a few clicks.
Peliqan acts as your data layer, providing clean, transformed data ready for visualization.
Step 2: Transform data with SQL
Prepare BI-ready datasets using SQL. Perform joins, aggregations, and filters across 250+ sources before sending to your BI tool.
Create materialized views that refresh automatically on schedule.
Build custom reports (optional)
For specialized needs, use low-code Python to generate personalized reports in Excel, Google Sheets, or PDF.
Distribute via email, Slack, MS Teams, or cloud storage with automated scheduling.
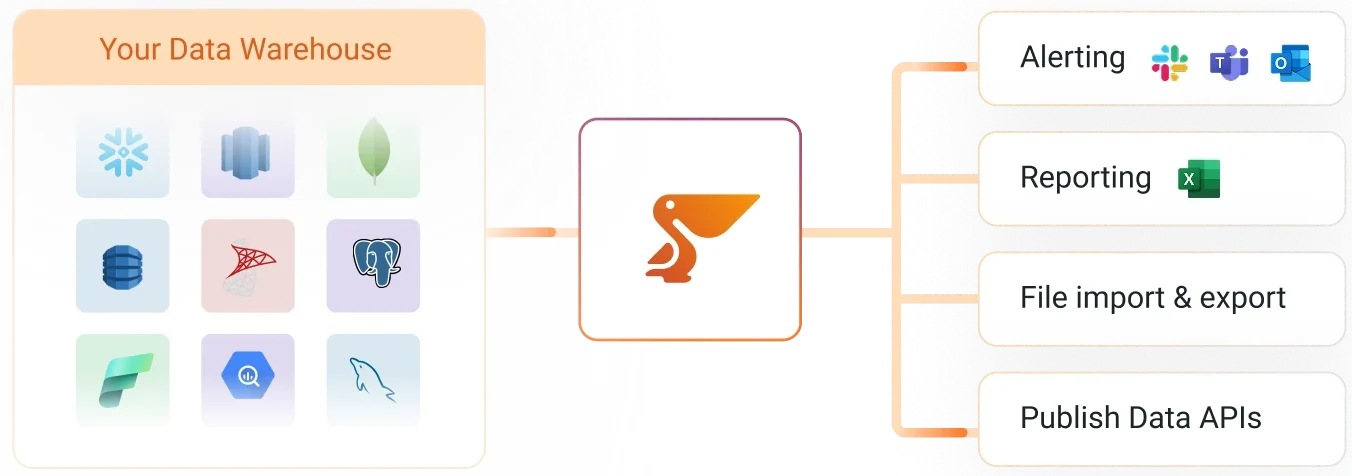
What else can you do with data activation?
Data activation is all the things you can do besides traditional BI to make your business more data-driven, automate processes, and increase productivity.
Business alerting
Send out business alerts based on data changes in your data warehouse. Alert individuals and teams on Slack and MS Teams.
Reporting & distribution
Generate personalized reports in Excel, Google Sheets and PDF. Distribute reports by email, SFTP or cloud storage (Google Drive, OneDrive, Sharepoint).
BI & Analytics
Connect Power BI, Tableau, Looker, and other BI tools to unified, clean data from 250+ sources. Or you can Metabase (built-in BI tool)
AI Chatbots
Implement a Chatbot similar to ChatGPT (LLM) based on your internal company data and enable language-based data interaction.
Business alerting
Send out business alerts based on data changes in your data warehouse. Alert individuals and teams on Slack and MS Teams.
Reporting & distribution
Generate personalized reports in Excel, Google Sheets and PDF. Distribute reports by email, SFTP or cloud storage (Google Drive, OneDrive, Sharepoint).
Data apps
Set up web-based forms and interfaces for data entry or for data access. Writeback updates into your database. Send real-time query results to the UI.
LLM Chatbots
Implement a Chatbot similar to ChatGPT (LLM) based on your internal company data and enable language-based data interaction.
Excel
Google Sheets
PDF
File import & export
Handle files at scale, both for data import into your data warehouse, as well as exporting data and distribution of files.
Easily handle cloud storage (OneDrive, Google Drive, Dropbox, Sharepoint), files on SFTP, and file attachments in emails. Work with any type of files: CSV, JSON, text files, Excel etc.
REST
Publish Data APIs
Easily publish Data APIs with selected datasets, for data sharing with partners, customers and suppliers. Handle custom logic in API endpoints with low-code Python.
Convert a custom query in an API endpoint instantly. Serve data using REST and JSON or any other data format.
SaaS connectors
Two-way
Data syncs
Sync data between business applications or between your data warehouse and business applications (Reverse ETL).
Use the 250+ Peliqan connectors for both reading data and writing to business applications, databases, files and other APIs.
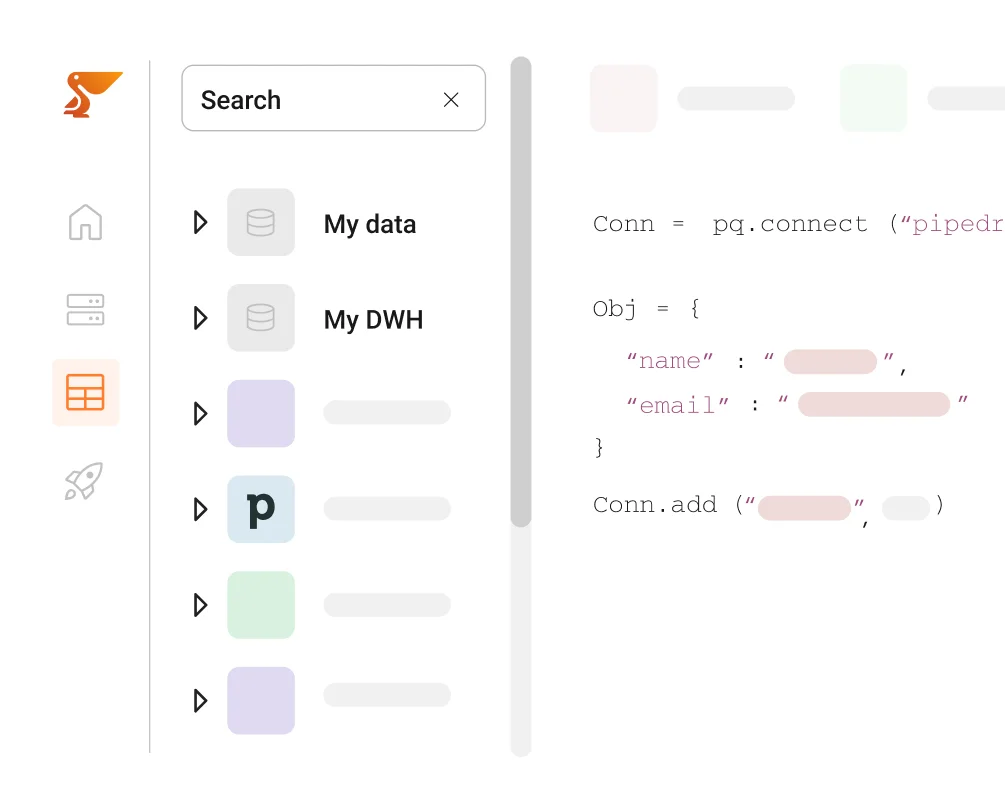
Python
Low code automations
Use low-code Python, combined with SQL, to implement any type of automation or integration. Writeback to business applications with easy function wrappers. Access data as data frames, use Streamlit for interactive UIs.
Code in your favourite IDE or in Peliqan directly. Schedule runs and view logs.
Need more data for your BI tool?
Peliqan is an all-in-one data platform with 250+ connectors and instant ETL pipelines. Every connector can instantly sync data into your data warehouse or directly into your BI tool.
No data warehouse yet ? Use Peliqan’s built-in data warehouse.
Instant ETL pipelines
BI-ready data
Sync to Peliqan's built-in DWH
Start building reports now !
Connect your favorite BI tool in minutes. Transform data with SQL and low-code Python. Build custom reports when you need them.
We use cookies to ensure that we give you the best experience on our website. If you continue to use this site we will assume that you are happy with it.
We use cookies to ensure that we give you the best experience on our website. If you continue to use this site we will assume that you are happy with it.