


You picked Cin7 Omni to unify your inventory across warehouses, sales channels, and fulfillment partners. The platform handles orders, purchasing, and stock movements well enough – but the moment you need a custom inventory report in Power BI, everything stalls. The API throws 429 rate-limit errors mid-refresh. Cross-entity joins between products, sales orders, and stock levels are either painfully slow or flat-out impossible. And exporting CSVs manually every Monday morning is not what a $349-per-month platform should require.
This guide walks through five practical ways to get Cin7 Omni data into Power BI – from quick-and-dirty API calls to warehouse-first architectures – so you can build inventory dashboards that actually refresh on schedule.
What is Cin7 Omni
Cin7 Omni is a cloud-based inventory and order management platform designed for mid-market and enterprise brands selling across multiple channels. It handles everything from warehouse management and EDI to B2B portals and 3PL integrations – with over 700 native integrations listed on its marketplace.
Cin7 Omni at a glance
The platform excels at operational inventory management. Where it falls short – and where most teams hit a wall – is reporting. Cin7 Omni’s built-in reports cover basics like stock on hand and sales summaries, but they lack the flexibility to build the kind of cross-dimensional dashboards that operations and finance teams need. That gap is exactly why so many Cin7 users look to Power BI.
Why connecting Cin7 Omni to Power BI is harder than it looks
On paper, Cin7 Omni has a REST API, and Power BI has a web connector. Problem solved, right? In practice, the integration hits several walls that make direct API connections unreliable for production dashboards.
Why the direct API approach breaks down
As one integration provider put it: “Reporting on Cin7 data directly via its API is simply not practical in Power BI.” Cross-entity queries involve joining across multiple endpoints – something that is poor-performing at best and impossible at worst. This is not a Power BI limitation. It is a fundamental mismatch between how REST APIs return data and how BI tools need to consume it.
The real cost of bad inventory reporting
When your Cin7 Omni data does not flow cleanly into Power BI, the consequences go beyond dashboard frustration. Poor inventory visibility has a direct financial impact that compounds over time.
The financial impact of inventory blind spots
These are not abstract numbers. For a mid-market brand running on Cin7 Omni with $5 million in annual inventory, even a 5% improvement in data integration accuracy could mean $75,000-$150,000 in recovered value per year through reduced carrying costs and fewer stockouts. The question is not whether you need Cin7 Omni data in Power BI – it is how fast you can get it there reliably.
5 ways to connect Cin7 Omni to Power BI
There is no single right way to get Cin7 Omni data into Power BI. The best approach depends on your team’s technical capacity, how many data sources you need to combine, and whether you need near-real-time updates or weekly snapshots are fine. Here are the five most common methods, ranked from simplest to most robust.
1. Manual CSV and Excel exports
The simplest method – and the one most Cin7 Omni users start with. Export stock reports, sales summaries, or product lists as CSV files from Cin7 Omni’s built-in reporting interface, then import them into Power BI Desktop.
This works for ad-hoc analysis and one-off reports. It completely breaks down when you need weekly refreshes across multiple data tables, because each export requires manual login, navigation, download, and file replacement. A team running 8-10 reports spends 3-5 hours per week on this cycle, and the data is stale before the dashboard loads. Most organizations that start here quickly realize they need a more automated integration approach.
Best for: One-off analysis, proof-of-concept dashboards, or teams with fewer than 500 SKUs and simple reporting needs.
2. Direct API connection via Power Query
Power BI’s built-in Web connector can call the Cin7 Omni REST API directly. You write M code (Power Query’s formula language) to authenticate, paginate through results, and transform JSON responses into tables. This gives you programmatic access to every endpoint – products, sales orders, purchases, stock movements, and more.
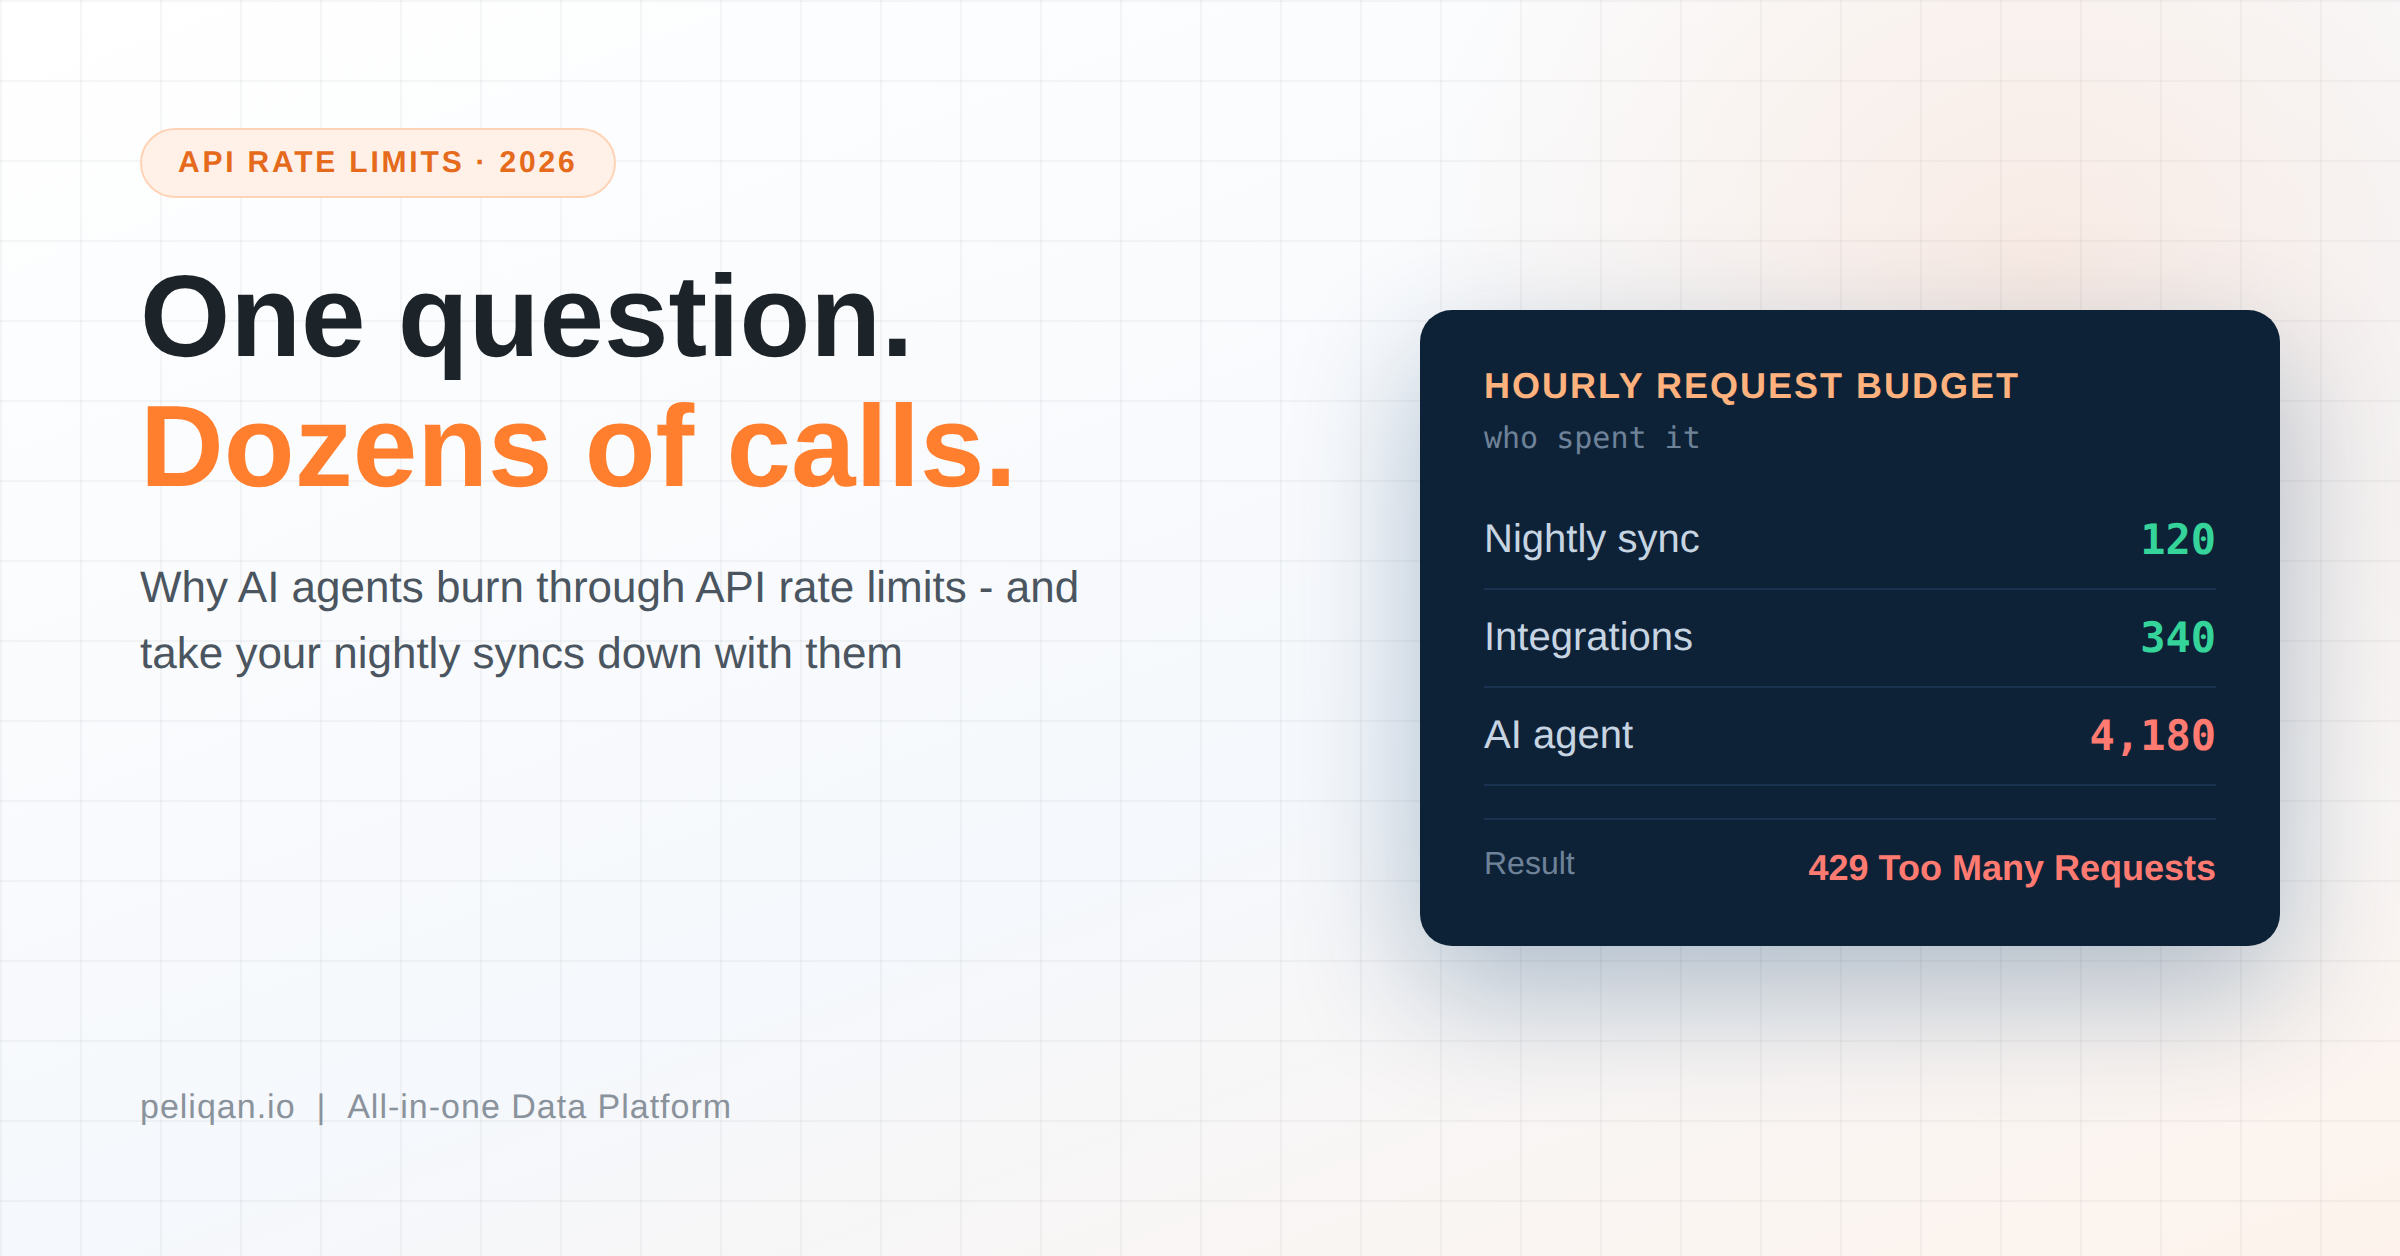
The technical barrier is moderate: you need someone comfortable writing custom M code with pagination logic, error handling for 429 rate-limit responses, and retry patterns. The bigger issue is reliability. Cin7 Omni’s API rate limits mean a data integration refresh that works fine with 1,000 products may fail consistently at 5,000 because you burn through your request budget before all pages load.
Best for: Small catalogs (under 2,000 SKUs), teams with a Power Query developer on staff, and scenarios where you only need 1-2 Cin7 entities in Power BI.
3. Third-party connectors – SyncHub, CData, and others
Several vendors have built dedicated Cin7 Omni connectors that handle the API complexity for you. SyncHub is the most prominent – it syncs Cin7 Omni data into a managed SQL database, then you connect Power BI to that database using the standard SQL Server connector. CData offers an ODBC/JDBC driver approach, and Acxtron provides custom dashboard builds on top of Cin7 data.
These solutions solve the rate-limit and pagination problems, but they introduce vendor lock-in and recurring costs. SyncHub polls Cin7 as frequently as every five minutes, depending on your plan, but transformation logic stays limited to what their platform supports. If you need to join Cin7 data with your Shopify sales, Xero accounting, or warehouse logistics data, you are still stitching things together manually in Power BI.
Best for: Teams that only need Cin7 data in Power BI (no multi-source joins), want a managed solution, and have budget for connector licensing.
4. Custom middleware – Azure Data Factory or Python scripts
For organizations with engineering resources, building a custom ETL pipeline gives you full control. Azure Data Factory can orchestrate API calls to Cin7 Omni, handle rate limiting with retry policies, stage data in Azure SQL or Blob Storage, and feed Power BI through DirectQuery or Import mode. Alternatively, Python scripts using the requests library can pull data on a schedule, transform it with pandas, and load it into a data warehouse.
The advantage is flexibility – you control every transformation, can handle incremental loads, and can combine Cin7 data with any other source. The disadvantage is maintenance. API changes, schema drift, and rate-limit adjustments all require developer intervention. Most teams that go this route spend 40-80 hours on initial build and 5-10 hours per month on maintenance.
Best for: Organizations with dedicated data engineers, complex transformation requirements, and existing Azure or cloud infrastructure.
5. Data integration platform with built-in warehouse
The warehouse-first approach separates data extraction from data analysis. A data integration platform connects to Cin7 Omni via a pre-built connector, syncs all your inventory tables into a managed data warehouse (Postgres, Snowflake, or BigQuery), and lets you transform data with SQL or Python before Power BI ever touches it.
This solves every problem in the chain: the platform handles API rate limits, pagination, and incremental syncs. The warehouse stores your full Cin7 dataset as proper relational tables with indexes and joins. And Power BI connects to the warehouse using a standard database connector – no custom M code, no rate-limit errors, no silent refresh failures.
The key difference from Method 3 is that your Cin7 data lives alongside every other data source in one warehouse. Need to join Cin7 sales orders with Shopify transactions, Xero invoices, or Google Analytics sessions? One SQL query. Need to calculate rolling 90-day inventory turnover by product category across channels? A SQL transformation that runs on schedule.
Best for: Mid-market and enterprise teams with multiple data sources, need for complex cross-platform reporting, and a preference for SQL-based transformation over drag-and-drop.
Comparing all five methods
| Method | Setup time | Refresh frequency | Cross-source joins | Maintenance | Cost range |
|---|---|---|---|---|---|
| CSV/Excel export | Minutes | Manual only | None | 3-5 hrs/week | Free (labor cost) |
| Direct API via Power Query | 8-20 hours | Scheduled (fragile) | Limited | 5-10 hrs/month | Free (dev time) |
| Third-party connector | 1-2 hours | Every 5-15 min | Cin7 only | Low | $100-$500/mo |
| Custom middleware (ADF/Python) | 40-80 hours | Custom schedule | Full flexibility | 5-10 hrs/month | $200-$2,000/mo |
| Integration platform + warehouse | 1-3 hours | Every 5-60 min | Unlimited sources | Minimal | $199-$500/mo |
Cin7 Omni data tables that matter most for Power BI
Cin7 Omni’s API exposes over 20 resource endpoints. Not all of them are useful for Power BI reporting. Below are the tables that drive 90% of inventory dashboard use cases, along with what you can build with each one.
| API resource | Key fields | Power BI use case |
|---|---|---|
| Product | SKU, category, barcode, weight, dimensions, custom fields | Product master dimension table – slice any metric by category, brand, or type |
| StockUnit | Product ID, branch, available, on hand, allocated, on order | Real-time stock levels by warehouse – the foundation of any inventory dashboard |
| StockMovement | Product, branch, quantity, movement type, date | Inventory velocity, shrinkage tracking, and stock movement trend analysis |
| SalesOrder / SalesOrderItem | Order date, customer, product, quantity, price, status, channel | Revenue by channel, sales velocity, demand forecasting inputs |
| PurchaseOrder / PurchaseOrderItem | Supplier, product, quantity, cost, expected date, status | Supplier lead-time analysis, cost tracking, and reorder point optimization |
| CreditNote / CreditNoteItem | Order reference, product, quantity, reason, date | Return rate analysis by product, channel, and time period |
| ProductionJob / ProductionJobProduct | BOM, input materials, output product, status, completion date | Manufacturing efficiency, WIP tracking, and material consumption reports |
| Contact | Customer/supplier name, type, address, payment terms | Customer segmentation, supplier performance scorecards |
The power of getting these tables into a proper warehouse is joins. In the Cin7 API, each table is an isolated endpoint. In a warehouse, you can join SalesOrderItem to Product to StockUnit in a single SQL query – giving you a report like “top 20 SKUs by revenue where current stock covers less than 14 days of sales velocity.” That query is impossible through the API alone.
Which method is right for your team
Decision framework – picking your Cin7 Omni to Power BI approach
Power BI data modeling tips for inventory data
Getting Cin7 Omni data into Power BI is only half the work. How you model that data inside Power BI determines whether your dashboards are fast, accurate, and maintainable. A few structural decisions early on save hours of debugging later.
Use a star schema
Cin7 Omni’s data maps naturally to a star schema. Place Products, Contacts, and Branches as dimension tables. Place SalesOrderItems, StockMovements, and PurchaseOrderItems as fact tables. This keeps your DAX calculations simple and your report rendering fast. Avoid dumping everything into one flat table – it works for 500 rows but chokes at 50,000.
Create a date table
Power BI’s auto date/time feature is not sufficient for inventory analysis. Build a dedicated date dimension with fiscal periods, weeks, and custom attributes like “peak season” flags. This lets you write time-intelligence DAX measures (year-over-year comparisons, rolling averages) that work correctly across all your Cin7 fact tables. Proper data modeling at this stage prevents most reporting errors downstream.
Calculate inventory turnover at the warehouse level
Cin7 Omni tracks stock by branch (warehouse). Build your turnover calculation at the branch-product grain, not globally. The formula is straightforward: cost of goods sold divided by average inventory value for the period. But getting COGS from SalesOrderItem cost fields and average inventory from daily StockUnit snapshots requires a data platform that stores historical snapshots – something the API alone cannot provide, since it only returns current state.
Handle incremental refreshes
If you are using Import mode (recommended for Cin7 data volumes), configure incremental refresh in Power BI to only pull new or modified records. This reduces refresh times from 30+ minutes to under 5 minutes for most SaaS data sets. It also plays nicer with Cin7 Omni’s API rate limits, since fewer records means fewer API calls per refresh cycle.
Set up row-level security early
If multiple teams or regions access the same Power BI report, configure row-level security based on the Branch or Contact fields from Cin7 Omni. This ensures your warehouse manager in Sydney only sees Australian stock levels, while your CFO sees the global rollup. Granular access controls at the data layer complement Power BI’s row-level security by restricting who can query the underlying warehouse tables. Plan both from the start.
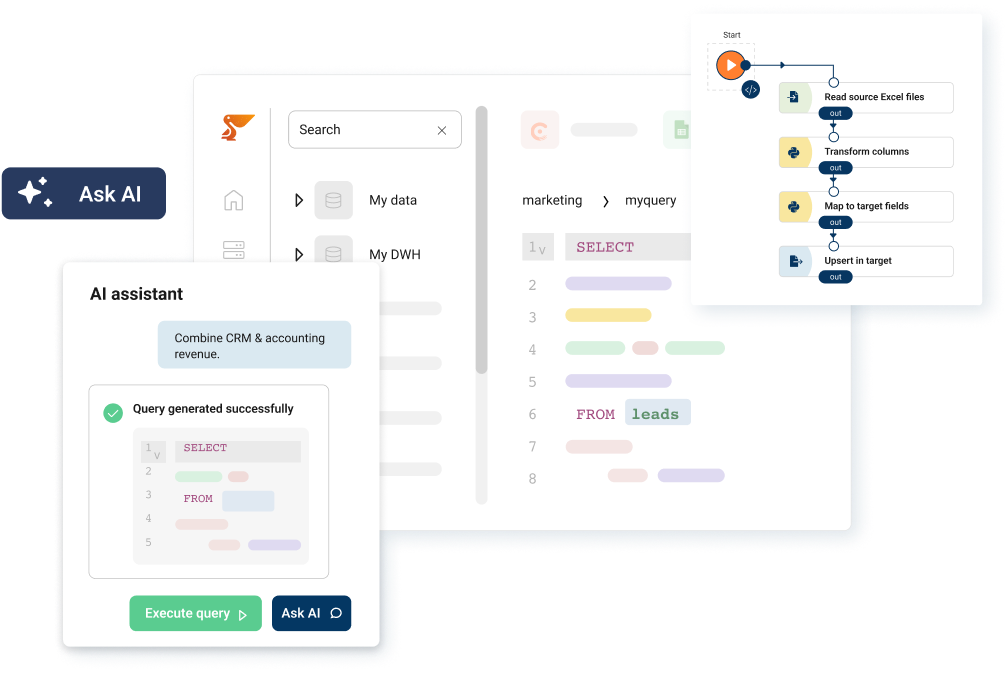
How Peliqan handles Cin7 Omni to Power BI
Peliqan is a data integration and activation platform with a pre-built Cin7 Omni connector that follows the warehouse-first approach described in Method 5. Here is how the pipeline works in practice.
Peliqan’s Cin7 Omni to Power BI pipeline
The practical difference is what happens after setup. With a direct API connection, every new report requirement means editing M code. With Peliqan, you write a SQL query against tables that already exist in your warehouse – the same way you would query any database. Need to add Xero accounting data next month? It is another connector click, not another integration project.
Peliqan’s automatic data lineage also means you can trace every number in your Power BI dashboard back to the source Cin7 Omni field – useful for audit trails and debugging when a metric looks off.
If you need to push calculated data back into Cin7 Omni or another system – like syncing reorder flags or updated lead times – reverse ETL handles that without custom scripts.
Pricing starts at $199 per month with the built-in warehouse included – no separate Snowflake or BigQuery bill. For a Cin7 Omni team already paying $349-$999 per month for inventory management, adding reliable Power BI reporting for $199 is a fraction of the cost of building and maintaining a custom pipeline.
Conclusion
Cin7 Omni is a strong inventory management software, but its reporting capabilities have not kept pace with what operations and finance teams need from Power BI. The API works for simple, low-volume use cases – and breaks for everything else.
If you are spending hours exporting CSVs, debugging rate-limit errors in Power Query, or maintaining fragile custom scripts, the problem is not your Power BI skills. It is the gap between how Cin7 Omni exposes data and how Power BI needs to consume it. A warehouse-first approach closes that gap permanently.
Start by mapping which Cin7 Omni tables drive your most critical reports – usually Products, StockUnits, SalesOrders, and PurchaseOrders. Then pick the integration method that matches your team’s capacity. For most mid-market brands, a data integration platform with a pre-built connector and managed warehouse delivers the best balance of speed, reliability, and cost.
The goal is not just getting data into Power BI. It is building inventory dashboards that refresh automatically, combine data from every source that matters, and give your team answers without waiting for an engineer to fix a broken pipeline.
If your reporting needs extend beyond Power BI, the same warehouse-first architecture supports every major BI tool – Tableau, Looker, Metabase, and more.