


The data integration market is experiencing a transformative growth cycle driven by AI adoption, cloud migration, and the urgent need to break down enterprise data silos – here are the key statistics, market projections, and trends shaping the industry in 2026 and beyond.
Data integration is no longer a back-office infrastructure concern. It is a strategic imperative. Organizations are generating over 2.5 quintillion bytes of data daily, yet the average enterprise uses 897 applications with only 29% of them integrated, according to MuleSoft’s 2025 Connectivity Benchmark Report. That means 71% of business applications remain disconnected, creating data silos, manual workarounds, and blind spots that directly erode revenue.
Meanwhile, global AI spending is forecast to surpass $2 trillion in 2026, growing 37% year over year according to Gartner. When AI investment scales, the cost of poor data integration scales with it. 95% of IT leaders now cite integration issues as the primary barrier to AI adoption – not algorithms, not compute, but simply getting the right data to the right place at the right time.
This statistics roundup compiles the most important data integration numbers for 2026 across market size, ETL, cloud warehousing, data quality, reverse ETL, and enterprise adoption – sourced from Gartner, IDC, MarketsandMarkets, Mordor Intelligence, IBM, McKinsey, and other leading research firms.
Data integration market size and growth statistics
The data integration market continues to expand at a double-digit pace as organizations invest in connecting their fragmented application landscapes. Here are the headline numbers.
- The global data integration market reached $14.33 billion in 2026 and is forecast to grow to $22.17 billion by 2031 at a 9.12% CAGR. The broader scope from MarketsandMarkets places the market at $17.58 billion in 2025, expanding to $33.24 billion by 2030 at a 13.6% CAGR, according to Mordor Intelligence and MarketsandMarkets.
- Grand View Research valued the market at $15.18 billion in 2024, projecting it will reach $30.27 billion by 2030 at a 12.1% CAGR. The variation across research firms reflects different scope definitions – some include iPaaS, APIs, and streaming alongside traditional ETL, per Grand View Research.
- Tools captured 63.85% of the data integration market in 2025, with services growing faster at a 14.08% CAGR between 2026 and 2031 as organizations increasingly outsource integration operations, according to Mordor Intelligence.
- Customer and sales analytics accounted for 29.18% of 2025 revenue, while operations and supply chain optimization is the fastest-growing application segment at a 15.74% CAGR through 2031, per Mordor Intelligence.
- Banking, financial services, and insurance (BFSI) commanded 24.12% of market revenue in 2025. Healthcare and life sciences is projected to climb at an 18.91% CAGR through 2031, driven by mandates like the 21st Century Cures Act requiring real-time interoperability, per Mordor Intelligence.
- Digital transformation spending is approaching $4 trillion by 2027, growing at 16.2% annually according to IDC. Data integration forms the critical backbone of these initiatives, enabling cloud migration, analytics, and automation.
Market size projections by research firm
Note: Variation reflects different scope definitions and forecast horizons. Sources: MarketsandMarkets, Grand View Research, Mordor Intelligence, Precedence Research.
The variation in market sizing across research firms underscores an important point: the data integration category is expanding in scope. What was once a narrow ETL vs ELT conversation now encompasses streaming, API integration, reverse ETL, and data activation – all driven by the need to connect more systems with less latency.
ETL and ELT market statistics
ETL remains the backbone of data integration, but it is evolving rapidly from batch-oriented data movers to intelligent, AI-powered automation platforms. The numbers reflect this transformation.
- The global ETL market reached $10.24 billion in 2026 and is forecast to expand to $21.25 billion by 2031 at a 15.72% CAGR, according to Mordor Intelligence.
- Cloud-based ETL solutions now dominate the market, representing approximately 60-65% of total deployments in 2025-2026. Organizations are prioritizing scalability, flexibility, and reduced infrastructure costs over on-premises alternatives.
- The cloud ETL market specifically reached $7.62 billion in 2024 and is projected to hit $22.86 billion by 2032 at a 14.80% CAGR, according to SNS Insider.
- SMEs represent the fastest-growing ETL segment at an 18.7% CAGR through 2030, outpacing enterprise adoption thanks to lower barriers and faster procurement cycles enabled by cloud-based, no-code ETL platforms.
- Software components dominate the ETL market with 70.92% revenue share, as enterprises consolidate around unified data integration suites.
- Organizations achieve 271% ROI within three years when migrating to cloud ETL, with payback periods under 6 months and infrastructure cost savings averaging $152,000 annually, according to Forrester TEI studies.
- Data engineering teams spend more than 61% of their time on data integration tasks, with 50% of organizations reporting this allocation. Modern data pipeline tools report significant reductions in integration time.
- North America commanded 39.32% of ETL market revenue in 2025, while Asia-Pacific is on track for a 17.08% CAGR through 2031.
The shift from ETL to ELT
A key trend within these statistics is the architectural shift from traditional ETL (transform before loading) to ELT (load first, transform in-warehouse). Modern cloud warehouses like Snowflake, BigQuery, and built-in warehouse solutions have enough compute power to handle transformations natively – making ELT faster, more flexible, and easier to maintain. This is not replacing ETL but expanding the toolkit, and it is a major driver behind the cloud ETL growth numbers above.
iPaaS market statistics
Integration Platform as a Service (iPaaS) is the fastest-growing segment of the data integration market, driven by SaaS proliferation and the need for low-code, citizen-developer-friendly integration tools.
- Gartner estimates iPaaS market revenue exceeded $9 billion in 2024, up from $7.8 billion in 2023 and $5.9 billion in 2022. Gartner forecasts the market will exceed $17 billion by 2028, per ONEiO.
- Fortune Business Insights projects the iPaaS market at $19.15 billion in 2026, growing to $108.76 billion by 2034 at a 24.20% CAGR, according to Fortune Business Insights.
- There are now over 900 integration software solutions in the market, with approximately 270 being specialized iPaaS offerings, per ONEiO Research.
- 72% of enterprises use multiple iPaaS platforms, and managed integration adoption is up 45% year over year, according to ONEiO Research.
- 62% of enterprises have adopted cloud-based integration frameworks, with over 54% prioritizing real-time data exchange, per Global Growth Insights.
- Large enterprises account for 59.79% of iPaaS market share in 2026, but SMEs are the fastest-growing segment, according to Fortune Business Insights.
Cloud data warehouse statistics
The cloud data warehouse market underpins the entire data integration ecosystem. As more organizations migrate from legacy on-premises systems, the demand for modern warehouse architectures and the integration tooling around them continues to accelerate.
Cloud data warehouse vendor landscape (2024-2025)
Sources: 6sense, Wing VC via DataPro, Mordor Intelligence.
- The cloud data warehouse market reached $14.94 billion in 2026 and is forecast to reach $49.12 billion by 2031 at a 26.86% CAGR, according to Mordor Intelligence.
- AWS, Microsoft, Google Cloud, and Snowflake collectively represented 68% of vendor revenue in 2024. Snowflake maintains approximately 35% of the cloud data warehouse market, per Mordor Intelligence and Wing VC via DataPro.
- Over 20,488 companies use Snowflake for data warehousing globally, while over 13,494 companies use Google BigQuery. Amazon Redshift holds 14.05% market share, according to 6sense.
- North America commands 46.20% of cloud data warehouse revenue, with Asia-Pacific poised for the fastest growth at a 33.6% CAGR through 2031, per Mordor Intelligence.
- BFSI captured 27.45% of cloud warehouse market share in 2025, while healthcare and life sciences is advancing at a 26.95% CAGR, according to Mordor Intelligence.
- Over 60% of enterprises now split workloads across multiple cloud vendors to avoid lock-in and isolate risk, per Firebolt.
- 73% of enterprises use hybrid cloud strategies, balancing security, flexibility, and cost optimization, according to Flexera’s 2026 State of the Cloud report.
The cost hidden in cloud warehouse pricing
Cross-cloud data transfer (egress) fees can consume 15-25% of analytics budgets. This is driving many organizations to consolidate workloads within a single cloud or to evaluate platforms with fixed, predictable pricing. 27% of cloud spend continues to be wasted, while budgets are exceeded by 17% on average – making cost management the top concern for 84% of organizations, according to Mordor Intelligence and Flexera’s 2026 State of the Cloud report.
Data quality statistics – the cost of getting it wrong
Data quality is the silent killer of integration projects. Without clean, consistent data flowing through transformation pipelines, even the most sophisticated architecture delivers unreliable results.
- Poor data quality costs organizations $12.9 to $15 million annually on average. IBM’s earlier estimate placed the cost to the US economy alone at $3.1 trillion per year.
- Over a quarter of organizations estimate they lose more than $5 million annually due to poor data quality, with 7% reporting losses of $25 million or more, according to the IBM 2025 CDO Study.
- 43% of chief operations officers identify data quality as their most significant data priority, per the IBM Institute for Business Value.
- 64% of organizations cite data quality as their top data integrity challenge. Organizations lose an estimated 25% of revenue annually due to quality-related inefficiencies, according to Precisely’s 2025 Data Integrity Trends Report.
- 77% of organizations rate their data quality as average or worse – an 11-point decline from prior years, according to Precisely’s 2025 research.
- Employees spend up to 27% of their time correcting bad data, slowing decision-making and increasing operational costs, according to Actian.
- 60% of companies do not even track the cost of bad data. Less than 40% of Global 2000 organizations have the metrics to assess data quality impact, according to HRS Research & Syniti.
- AI spending is forecast to surpass $2 trillion in 2026, and when AI investment scales, the cost of poor data quality scales with it, per Gartner.
These numbers make a compelling case for investing in data quality monitoring before, during, and after any integration project.
Enterprise data silos and integration challenges
The gap between how many systems organizations use and how many are actually connected represents one of the largest operational inefficiencies in enterprise IT.
- The average enterprise uses 897 applications, with only 29% integrated. 71% of business applications remain disconnected, according to MuleSoft’s 2025 Connectivity Benchmark.
- 68% of enterprise data remains unleveraged, sitting idle in warehouses and databases without being activated in business operations or decision-making.
- 68% of data professionals cite data silos as their top concern, up 7% from the previous year, according to DATAVERSITY’s 2024 Trends in Data Management.
- 87% of organizations struggle with disconnected data sources, leading to inefficiencies in operations and decision-making, according to Gartner via BizData.
- 55% of enterprise data is considered “dark” – stored but unused. Costs the average enterprise $1.7 to $3.3 million annually, per DataStackHub.
- 84% of all system integration projects fail or partially fail. Large-scale projects show 50% higher failure rates than incremental approaches.
- Organizations manage 5-7 specialized data tools on average, with 70% of data leaders reporting stack complexity as a challenge.
Reverse ETL and data activation statistics
Reverse ETL represents the other half of the integration equation – syncing enriched data back to CRMs, marketing tools, and operational systems for action.
Growth rate comparison – reverse ETL vs traditional integration
Sources: MarketsandMarkets, Grand View Research, Mordor Intelligence, Fortune Business Insights.
- The data pipeline tools market (which includes reverse ETL) was valued at $12.1 billion in 2024 and is growing at a 26% CAGR through 2030, according to Grand View Research.
- The reverse ETL growth rate of 26% CAGR nearly doubles the broader data integration market’s 12.1% CAGR, highlighting the accelerating shift from analytics-only use cases to operational data activation.
- Organizations using reverse ETL report 15-30% reduction in customer acquisition costs and 25-45% higher conversion rates, with most implementations reaching positive ROI within 3 months.
- 71-78% of reverse ETL implementations are cloud-based, with AWS (32%), Azure (23%), and GCP (10%) providing the scalability to process billions of records.
- The CDP market where reverse ETL plays a vital role is valued at $3.71 to $7.51 billion, according to Mordor Intelligence.
- Fivetran’s acquisition of Census in 2025 signals the strategic importance of reverse ETL, adding data activation to one of the largest data connector platforms.
AI and data integration statistics
AI is both a driver of data integration demand and a technology transforming how integration platforms work. The intersection of AI and data pipeline architecture is where some of the most dramatic shifts are occurring.
- 95% of IT leaders cite integration issues as the primary barrier to AI adoption. Only 28% have connected their applications effectively, according to MuleSoft’s 2025 Connectivity Benchmark.
- 78% of organizations use AI in at least one business function, according to McKinsey’s State of AI 2025.
- Global AI spending exceeded $100 billion in VC funding during 2024, an 80% increase from $55.6 billion in 2023.
- Companies with strong integration achieve 10.3x ROI from AI versus 3.7x for those with poor connectivity, according to IDC via APPSeCONNECT.
- GenAI will increase useful data by 40% through better unstructured data leverage by 2026, according to Gartner.
- 80% of data professionals now use AI daily, up from 30% in 2023. Organizations are allocating an average of $2.5 million in GenAI budgets.
- Gartner predicts AI agents will augment or automate approximately 50% of business decisions by 2027, fundamentally changing what integration platforms need to support.
Skills gap and workforce statistics
The talent shortage in data engineering and integration is one of the most significant constraints on market growth. Low-code platforms are emerging as a partial solution.
- 90% of organizations face data and AI talent shortages by 2026, potentially costing $5.5 trillion in global output, according to Mordor Intelligence.
- 85% of organizations believe they need more data engineers despite AI automation. The complexity of modern data stacks requires specialized expertise that remains scarce.
- Gartner predicts 70% of new applications will use low-code or no-code by 2026, creating a 4:1 citizen-to-professional developer ratio, according to Gartner via Rapidi.
- Data scientist employment is projected to grow 36% from 2023-2033, but demand continues to outpace supply across virtually every industry.
- 75% of C-level executives report workforce skills gaps in data capabilities, with data analysis, AI/machine learning, and data engineering topping the list.
Real-time and streaming integration statistics
The shift from batch processing to real-time data integration is one of the defining trends of 2026.
- The streaming analytics market was valued at $23.4 billion in 2023 and is projected to reach $128.4 billion by 2030 at a 28.3% CAGR, according to MarketsandMarkets via Rapidi.
- Apache Kafka is used by over 40% of Fortune 500 companies through Confluent’s platform, handling trillions of messages daily.
- Event-driven architecture has reached mainstream adoption – 72% of organizations use EDA, though only 13% have achieved organization-wide maturity.
- IoT connected devices are growing from 18.8 billion in 2024 to 40 billion by 2030, creating massive real-time integration demands. The US IoT market alone is expanding to $553.92 billion by 2030.
- 50% of critical applications will reside outside centralized clouds by 2027, according to Gartner via Rapidi.
Data integration market segments compared
What these statistics mean for your data strategy
Key takeaways for data leaders
- Integration is the AI bottleneck: 95% of IT leaders say integration – not algorithms or compute – is what blocks AI adoption. Fixing your data plumbing is the highest-leverage investment for AI readiness.
- Tool sprawl is the new enemy: With 897 apps per enterprise and 5-7 data tools in the average stack, consolidation beats best-of-breed for most mid-market teams.
- Real-time is table stakes: Streaming analytics is growing at 28.3% CAGR versus 12-14% for traditional integration. If your architecture is still batch-only, you are falling behind.
- Data quality compounds everything: $12.9M+ lost per year per organization – and 60% do not even track it. Quality monitoring needs to be embedded in your integration layer.
- Reverse ETL closes the loop: Activating data back into operational systems is where 15-30% CAC reduction and 25-45% conversion rate improvements live.
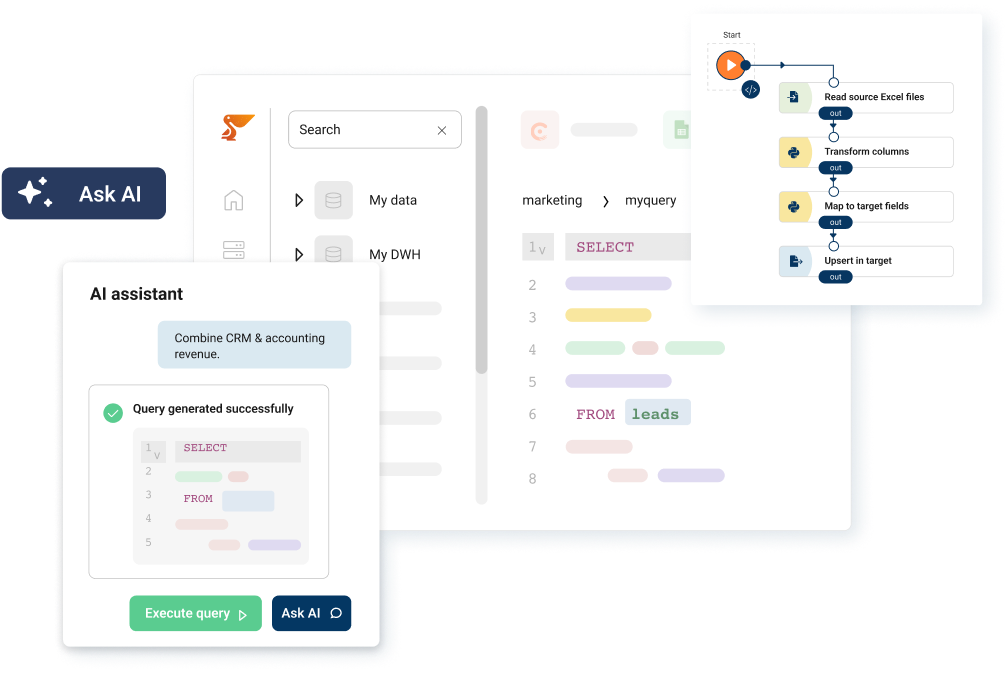
For teams looking to address these challenges without assembling a fragmented multi-vendor stack, all-in-one platforms that include ETL, built-in warehousing, data transformation, quality monitoring, and reverse ETL in a single environment can dramatically reduce complexity. With fixed, predictable pricing and white-label capabilities, platforms like Peliqan are designed for exactly this use case – connecting 250+ data sources to a built-in Postgres/Trino warehouse with transformation, activation, and monitoring included from day one.
Conclusion
The data integration market in 2026 is defined by urgency. AI is creating unprecedented demand for clean, connected, real-time data. Cloud migration is accelerating across every industry and region. And the enterprise integration gap – 897 apps, 29% connected – represents both the biggest risk and the biggest opportunity in modern data strategy.
The statistics in this roundup tell a consistent story: organizations that solve their integration challenges early achieve dramatically better outcomes from every other data initiative, from AI to analytics to customer experience. Those that delay face compounding costs – not just in dollars, but in competitive positioning.
Whether you are evaluating your first integration platform or consolidating a sprawling multi-tool stack, the market data points in one direction: invest in integration now, invest in quality from the start, and choose platforms that grow with you rather than lock you in. See how Peliqan builds a data warehouse in 10 minutes – or start a free trial to connect your sources and experience integrated data firsthand.