


If you’re one of the 14,000+ organisations running AFAS Profit and you’ve started trying to build a Power BI dashboard from your ERP data, you’ve probably hit a wall. The OData connector only refreshes twice a day, the Power BI Service gateway throws authentication errors with AFAS tokens, and the standard templates don’t match your actual KPIs. Since AFAS dropped Qlik on 1 December 2025, every organisation that relied on managed dashboards has had to find a new approach – and most are discovering that connecting AFAS to Power BI is significantly more complex than the official documentation suggests.
This guide covers every method for connecting AFAS Profit to Power BI, what works, what doesn’t, and why a warehouse-first approach solves the problems the OData connector can’t.
What is AFAS Profit?
AFAS Profit at a glance
AFAS Profit is the dominant ERP platform in the Dutch-language market. Unlike global giants such as SAP or Microsoft Dynamics, AFAS is designed specifically for mid-sized Dutch and Belgian organisations – covering everything from payroll and HR to project billing and order management in a single system. Its depth in HRM and payroll is particularly strong, which is why finance and HR teams rely on it as their single source of truth for headcount data, absence records, and salary runs.
That depth is also what makes reporting on AFAS data complicated. The data model is rich and highly relational, but the native reporting tools have always been limited – and the tool AFAS relied on to bridge that gap, Qlik, was discontinued in late 2025. Most organisations are now in the middle of rebuilding their reporting layer from scratch.
AFAS dropped Qlik – what that means for your reporting
What changed on 1 December 2025
For teams that relied on AFAS’s managed Qlik dashboards, this was a significant shift. Those dashboards are gone. The AFAS Qlik connector remains available through third-party platforms for teams that want to keep Qlik as their BI tool – but for most organisations, the migration to Power BI is now underway and the question is how to do it reliably.
The good news is that Power BI is a considerably more capable platform than the Qlik solution AFAS offered. The challenge is connecting it to your AFAS data in a way that actually scales – which is where most teams run into trouble almost immediately.
Why connecting AFAS to Power BI is harder than it looks
AFAS provides official documentation for its OData connector, and the setup in Power BI Desktop is genuinely straightforward. The problems emerge when you try to move beyond that initial connection – when you publish to the Power BI Service, when you need historical data, or when you want to join data from more than one AFAS module in a single report.
Technical limitations of the AFAS OData connector
These are not edge cases – they are structural constraints that affect every AFAS organisation trying to build a Power BI reporting layer. The OData approach was designed as a lightweight bridge, not as an enterprise-grade data pipeline. For simple dashboards with small datasets from a single module, it works. For organisations that need cross-module analytics, trend analysis over multi-year datasets, or data combined from AFAS and other business systems, the OData connector quickly becomes a bottleneck that no amount of Power BI optimisation can fix.
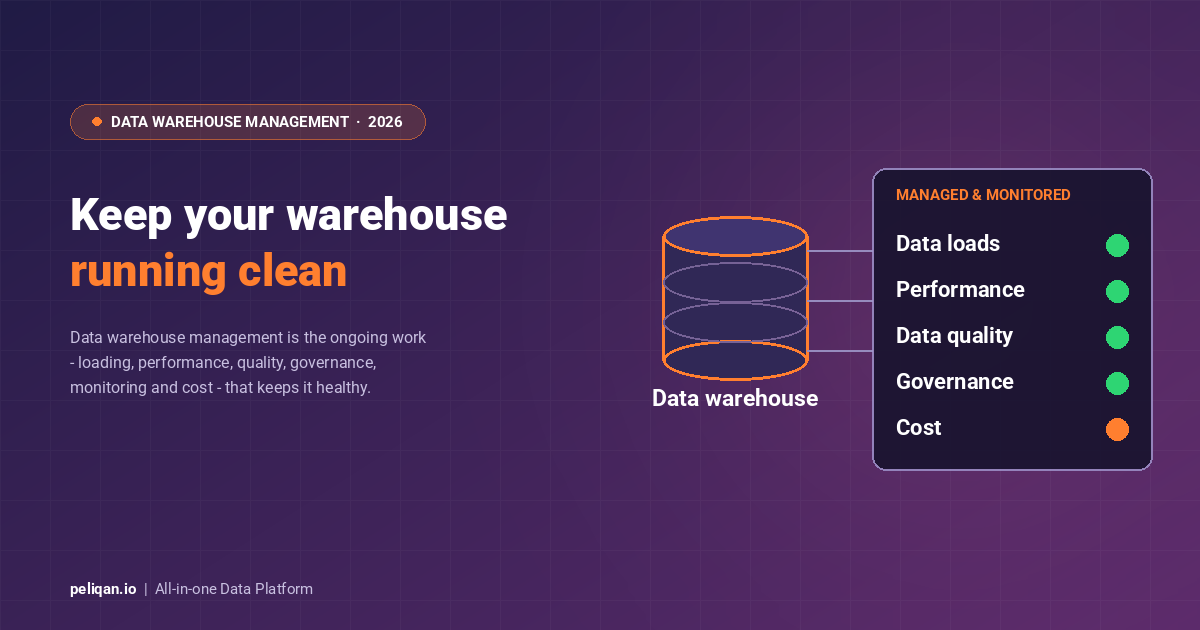
The real cost of limited AFAS reporting
What poor data visibility actually costs
For most AFAS customers, the reporting gap isn’t a technical curiosity – it has a direct impact on how fast management can act on operational data. The more complex the reporting requirement, the more expensive the workaround, and the greater the risk that decisions get made on yesterday’s numbers instead of today’s.
5 ways to connect AFAS Profit to Power BI
There is no single “right” way to connect AFAS to Power BI. The best approach depends on your team’s technical capacity, the size and complexity of your dataset, and how many data sources you need to combine. Here are the five most common methods, moving from simplest to most robust.
Method 1: AFAS native OData connector with Power BI templates
AFAS provides an OData endpoint that exposes data from your configured BI models in Profit. Connecting a BI tool via OData requires pasting your AFAS OData URL into Power BI Desktop and authenticating with an AFAS-generated token. AFAS also provides standard template dashboards – including an HR mobility dashboard, absence reporting, and sales revenue views – that you can import directly into Power BI and adapt.
The setup is genuinely simple and works well for small datasets from a single module. The limitations appear quickly: the 2x/day refresh ceiling means your dashboards are always working with data that is at least several hours old. The 10,000-row cap is a hard constraint for organisations with multi-year transaction histories in finance or payroll. And the gateway authentication issue means publishing to the Power BI Service – which is how most organisations share reports with management – often requires workarounds that aren’t documented clearly in AFAS’s own help centre.
Best for: Small AFAS environments, teams just starting with Power BI, single-module use cases covered by AFAS’s standard templates (HR attendance, basic revenue).
Method 2: Power BI Desktop with custom GetConnectors
For more specific reporting requirements, your AFAS administrator can create custom GetConnectors that expose exactly the fields and entity combinations you need. A custom GetConnector is essentially a saved view in the AFAS data model – you define which entities to join, which fields to expose, and any filtering logic, and the result becomes a new OData endpoint that Power BI can consume. This gives you more control over the data shape than the standard templates allow.
Custom GetConnectors solve the schema problem but don’t fix the underlying OData limitations: refresh rate, row cap, and gateway authentication issues all still apply. More importantly, every new reporting requirement means a new GetConnector request to your AFAS administrator. In practice, this creates a reporting bottleneck – data teams waiting for admin capacity to build or modify connectors before they can update dashboards. Organisations with active reporting needs find that the backlog of GetConnector requests becomes a constraint on their entire analytics programme.
Best for: Teams with available AFAS admin capacity, specific single-module reporting needs (payroll-only or finance-only dashboards), environments where twice-daily refresh is genuinely acceptable.
Method 3: Third-party connector (Invantive Cloud)
Invantive Cloud offers a dedicated Power BI connector for AFAS Profit that provides more direct data access than the native OData approach. It bypasses some of the gateway authentication issues and supports more granular querying of AFAS data through its own SQL-like query layer (ANSI SQL with Invantive extensions). For developers comfortable with SQL, this is a meaningful step up from the OData connector.
The trade-off is an additional paid subscription, a proprietary query language, and a dependency on a third-party service sitting between your ERP and your BI tool. Invantive works well for single-ERP Power BI reporting but doesn’t help you combine AFAS data with other business systems or build a governed data layer for the wider organisation. If your primary need is AFAS-only reporting in Power BI with fresher data than OData provides, it’s a pragmatic option – but it’s a point solution rather than an infrastructure investment.
Best for: Developers familiar with SQL, teams needing fresher AFAS data in Power BI without building custom pipelines, single-ERP reporting environments.
Method 4: Custom API pipeline (Azure Data Factory, Python, etc.)
For organisations with engineering resources, building a custom pipeline using the AFAS REST API is the most flexible option. Azure Data Factory has community-built connectors for AFAS, and open-source PHP and Python libraries exist for interacting with GetConnector and UpdateConnector endpoints. The typical architecture: extract data from AFAS via API, land it in Azure SQL, Synapse, or an on-premises database, then connect Power BI to that database instead of directly to AFAS.
This approach gives you full control over refresh schedules, data volume, and transformation logic. It’s also expensive to build and maintain. The AFAS REST API requires TLS 1.2, enforces a 75 MB per call limit, and requires careful pagination management for entity sets that grow over time. Schema changes in AFAS – new fields in GetConnectors, renamed connectors, deprecated entities – can silently break pipelines without data lineage tracking to alert your team when upstream data changes. Most organisations that build custom pipelines underestimate the ongoing maintenance burden as AFAS evolves.
Best for: Organisations with dedicated data engineering teams, Azure-first environments, scenarios requiring custom transformation logic at the pipeline level.
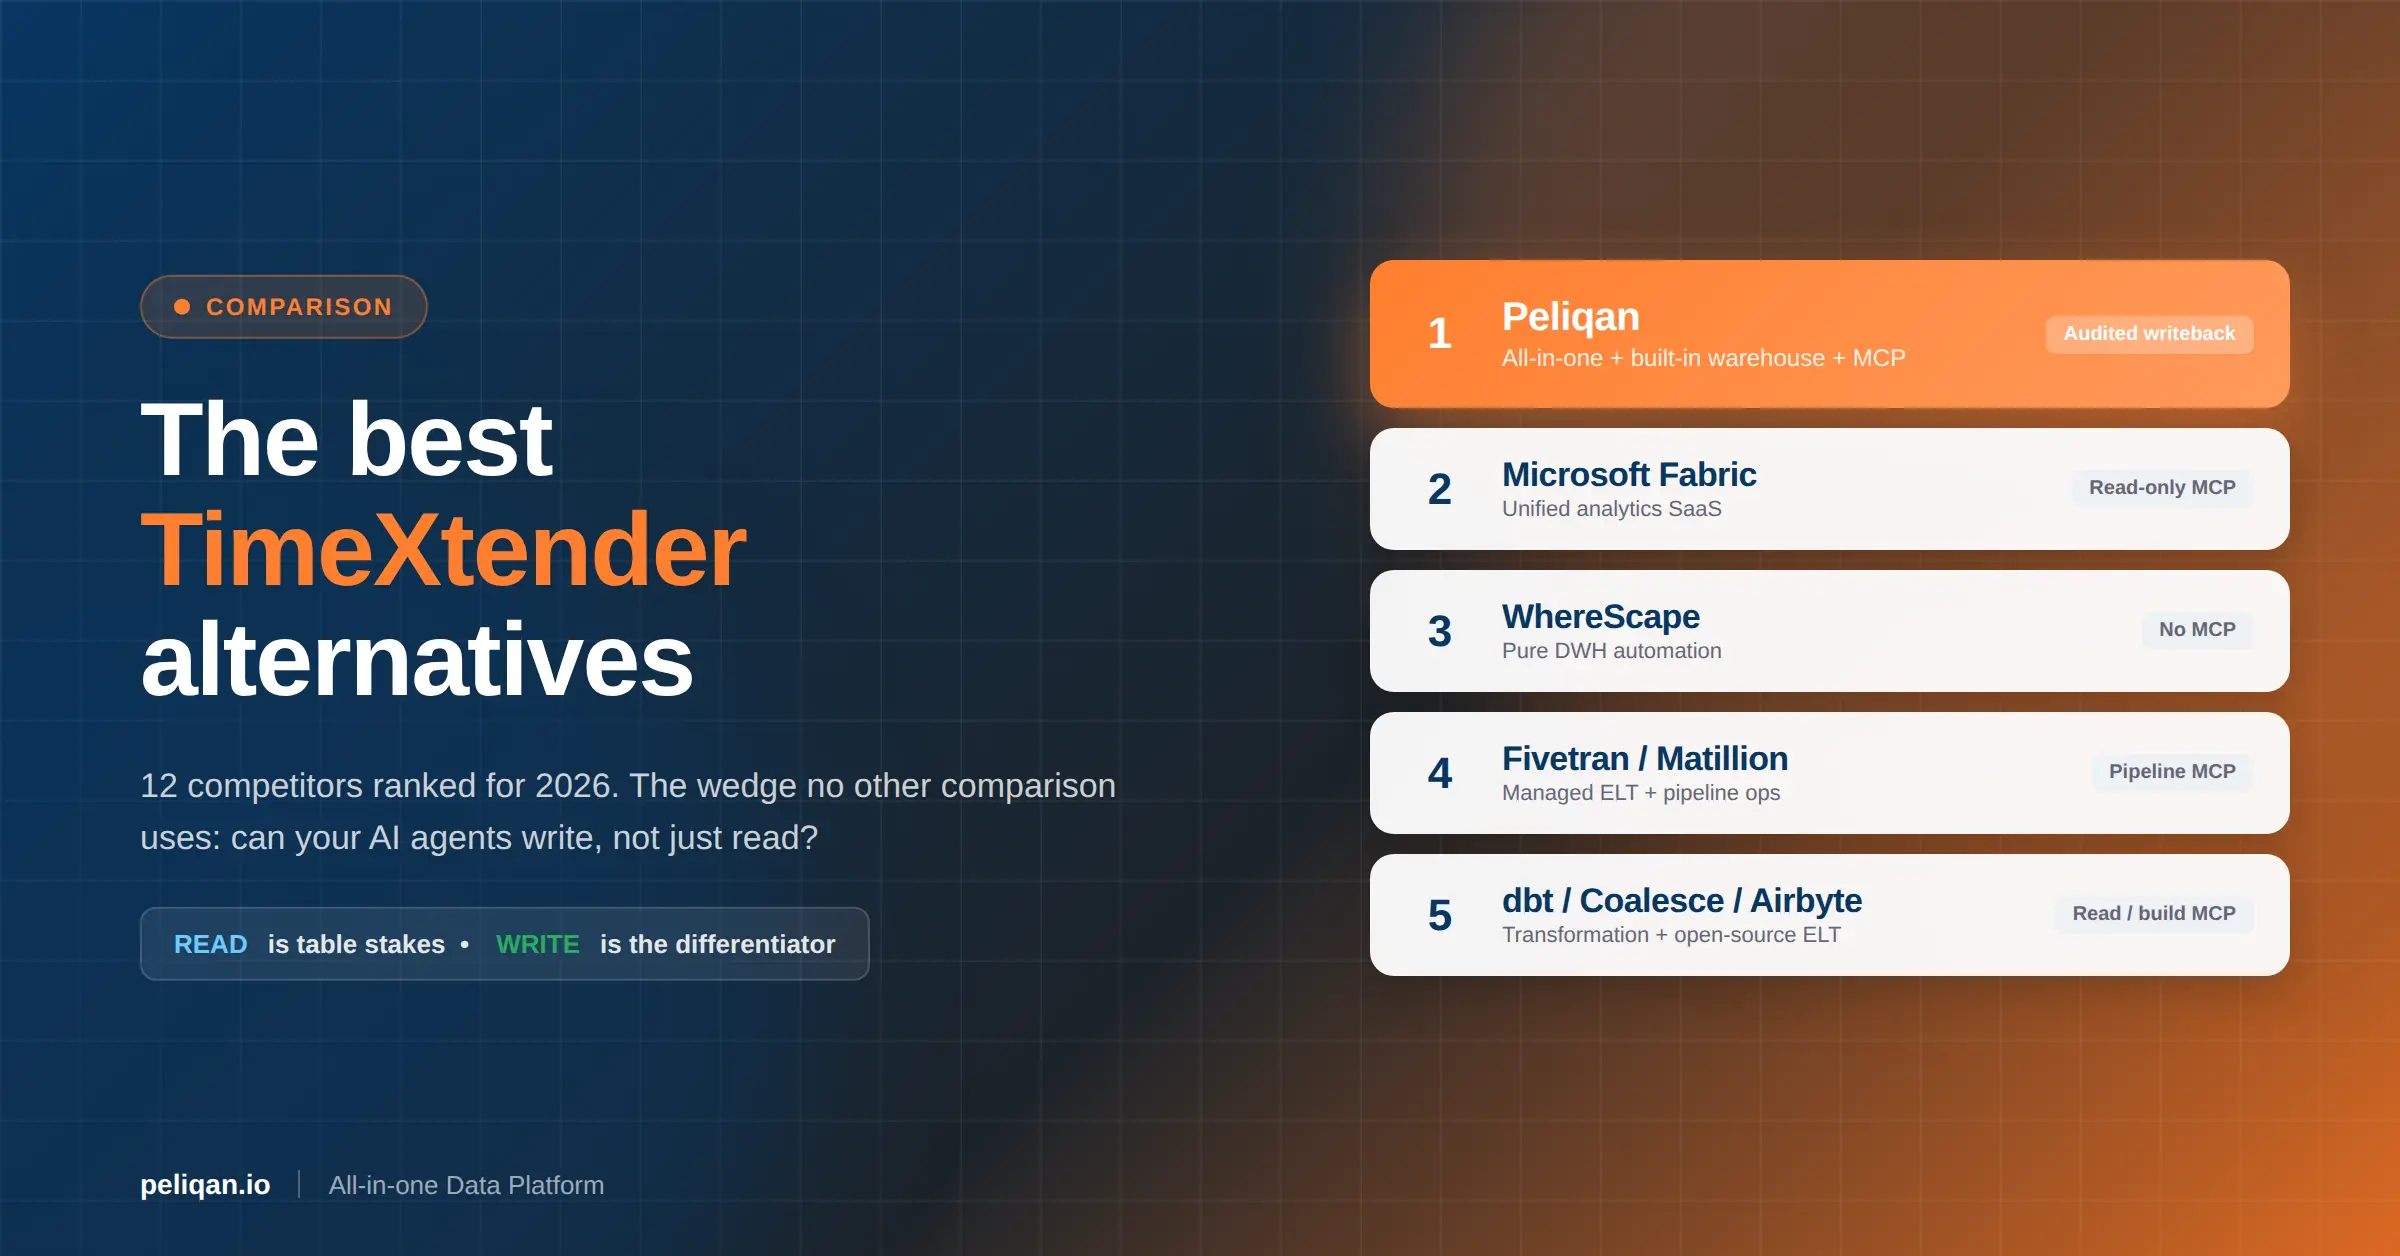
Method 5: Data warehouse platform (Peliqan)
The warehouse-first approach solves the structural problems that the OData connector cannot. Instead of connecting Power BI directly to AFAS, you sync AFAS data into a governed data warehouse and connect Power BI – or any BI tool – to that warehouse. This eliminates the refresh rate ceiling, the row cap, and the gateway authentication issues in a single architectural step.
Platforms like Peliqan handle the AFAS connector, the warehouse, and the transformation layer as a unified service. Your AFAS data lands in a structured Postgres or Trino warehouse, where you can write SQL to join entities across modules, clean and standardise data, and build the exact tables your Power BI reports need – without configuring GetConnectors in AFAS itself. Scheduled syncs keep the warehouse in step with your AFAS environment automatically. The AFAS Power BI connector in Peliqan is one of 250+ connectors available on the same platform, meaning your AFAS data can be joined with HubSpot, SD Worx, Exact Online, or any other source your business uses.
Best for: Organisations needing cross-module reporting (payroll + finance + projects), teams combining AFAS with other business systems, finance and HR teams who want a single governed data layer that multiple BI tools can query.
Comparison: AFAS to Power BI connection methods
| Method | Setup effort | Refresh rate | Row limit | Cross-module joins | Ongoing cost |
|---|---|---|---|---|---|
| Native OData + templates | Low | 2x/day max | 10,000 rows | No | Free (included) |
| Custom GetConnectors (OData) | Medium | 2x/day max | 10,000 rows | Custom only | Admin time per change |
| Invantive Cloud | Medium | Near real-time | High | Limited | Paid subscription |
| Custom API pipeline | High | Configurable | Unlimited | Yes (dev effort) | Engineering time + infra |
| Data warehouse (Peliqan) | Low | Scheduled (configurable) | Unlimited | Yes (SQL) | Fixed platform fee |
AFAS data tables that matter most for Power BI dashboards
Understanding what data AFAS exposes – and how it maps to real reporting requirements – is the first step to building useful dashboards. AFAS organises all data access through GetConnectors, which are configurable views on the Profit database. Standard GetConnectors cover the most common entity types; custom GetConnectors allow you to define specific joins and field selections for your reporting needs. Here are the most commonly used data domains and the dashboard use cases they power.
| AFAS data domain | Key entities / GetConnectors | Power BI dashboard use case |
|---|---|---|
| HRM | Employees, contracts, org structure, roles, job titles | Headcount trends, FTE by department, contract type breakdown, org chart view |
| Absence and leave | Absence records, leave balances, sick day registrations | Absence rate by team, YTD sick leave, leave liability, Bradford factor |
| Payroll | Salary runs, wage components, cost centres, employer costs | Total payroll cost by period, wage component breakdown, payroll variance, payroll-to-revenue ratio |
| Finance / accounting | General ledger, journal entries, accounts receivable, accounts payable, budgets | Monthly P&L, debtor aging, cash flow dashboard, budget vs. actual |
| Projects | Projects, hours logged, budgets, milestones, billing lines | Project margin, billable vs. non-billable hours, milestone tracking, budget burn |
| Order management | Sales orders, purchase orders, invoices, products, customers | Revenue by customer, open orders, invoice aging, purchase spend by supplier |
| CRM | Contacts, accounts, opportunities, activities, segments | Pipeline by stage, activity volume, win rate, customer revenue contribution |
KPIs every AFAS Power BI dashboard should track
The challenge with AFAS reporting is not a shortage of data – it’s knowing which metrics to surface for each audience, and which data entities need to be combined to calculate them accurately. Here are the most impactful KPIs across AFAS’s four core reporting domains.
HR and workforce KPIs
Headcount by department, FTE equivalent, and contract-type breakdown are the foundation of any HR dashboard. These depend on the Employees and Contracts GetConnectors, joined against the org structure data. Beyond headcount, absence rate (sick days as a percentage of total working days) and voluntary turnover rate require absence records, contract start/end dates, and departure reason codes. Joining these entities across separate GetConnectors is where the OData approach starts to show its limits – each entity lives in a separate endpoint and meaningful joins require either custom GetConnectors or a warehouse layer where you can write free-form SQL.
Finance and accounting KPIs
Monthly P&L, budget vs. actual variance, and debtor aging are the three views finance directors request most from AFAS data. Each requires data from the general ledger combined with cost centre hierarchies and, for budget vs. actual, the AFAS budget table. Cross-entity reporting of this kind is precisely what custom GetConnectors were designed for – but building and maintaining one GetConnector per reporting view creates the admin dependency problem described above. Transforming raw journal entry data into a clean P&L structure in a warehouse layer is considerably more flexible: you write the transformation once in SQL, and it runs automatically every sync cycle.
Payroll KPIs
Total payroll cost by period, payroll cost as a percentage of revenue, and wage component breakdown (base salary vs. allowances vs. employer social security contributions) are the most-requested payroll views in AFAS environments. For Dutch organisations, this typically includes the werkgeverslasten breakdown that maps employer costs to individual employees. These calculations require combining Payroll module data with Finance data to compute ratios like payroll-to-revenue – which means two separate AFAS modules that don’t sit in the same GetConnector by default. Cross-module payroll reporting is one of the clearest cases where the OData approach runs out of room.
Project profitability KPIs
For consultancies, construction firms, and professional service businesses running AFAS, project margin is consistently the most-requested dashboard metric. Computing true project margin requires combining project hours from the Projects module, billing data from Order management, and payroll cost from Payroll – three separate AFAS entities that have no out-of-the-box GetConnector joining them. The warehouse-first approach used in Exact Online Power BI reporting applies equally well to AFAS project analytics: sync all modules into a centralised warehouse, build a unified data model, and let Power BI query pre-built margin tables rather than piecing together OData endpoints.
Which AFAS-to-Power BI method should you choose?
Decision framework
How Peliqan connects AFAS Profit to Power BI – and any other BI tool
What the Peliqan AFAS connector includes
The practical difference between Peliqan and the native OData approach is most visible when you try to build cross-module reports. Computing project margin requires hours from Projects, billing from Order management, and payroll cost from Payroll – three AFAS entities with no out-of-the-box GetConnector joining them. In Peliqan, it’s a SQL JOIN across three tables that already exist in your warehouse after the initial sync. You can connect your AFAS environment and start writing queries against your data within minutes, without waiting for GetConnector configuration from your AFAS admin.
For organisations with multiple BI tools in use – Power BI for finance leadership, AFAS Metabase integration for operational teams who prefer a lighter reporting interface – the warehouse approach means all teams query the same governed, quality-checked data. There is no drift between the numbers in the finance dashboard and the numbers in the HR dashboard, because both query the same warehouse tables.
Peliqan’s materialised table layer ensures that complex transformation queries run once per sync cycle and the results are cached in the warehouse, rather than re-executing expensive SQL every time a Power BI report loads. This matters particularly for payroll and project margin calculations that aggregate across many rows – queries that would time out if run live against an API, but execute in milliseconds against a materialised warehouse table.
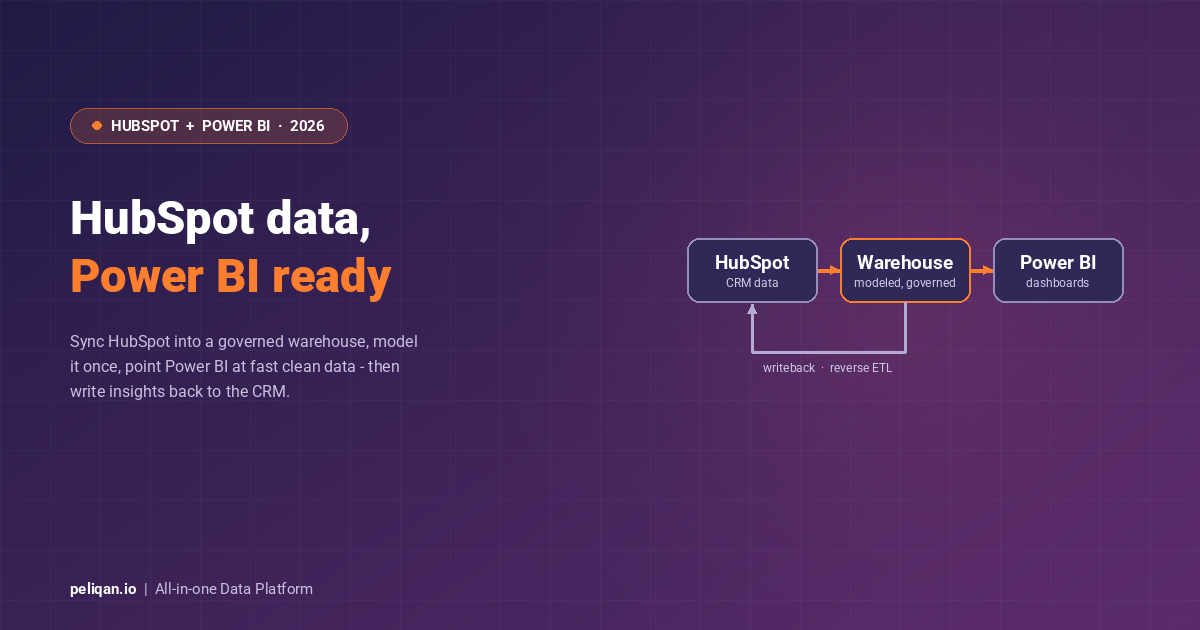
Reverse ETL is increasingly relevant for AFAS customers who want a two-way integration rather than read-only reporting. Rather than just extracting AFAS data for dashboards, reverse ETL lets you push enriched data back – syncing budget figures calculated in your warehouse back into AFAS Profit, or updating employee cost centre allocations based on data from an external HR system. This closes the loop between your reporting layer and your operational systems.
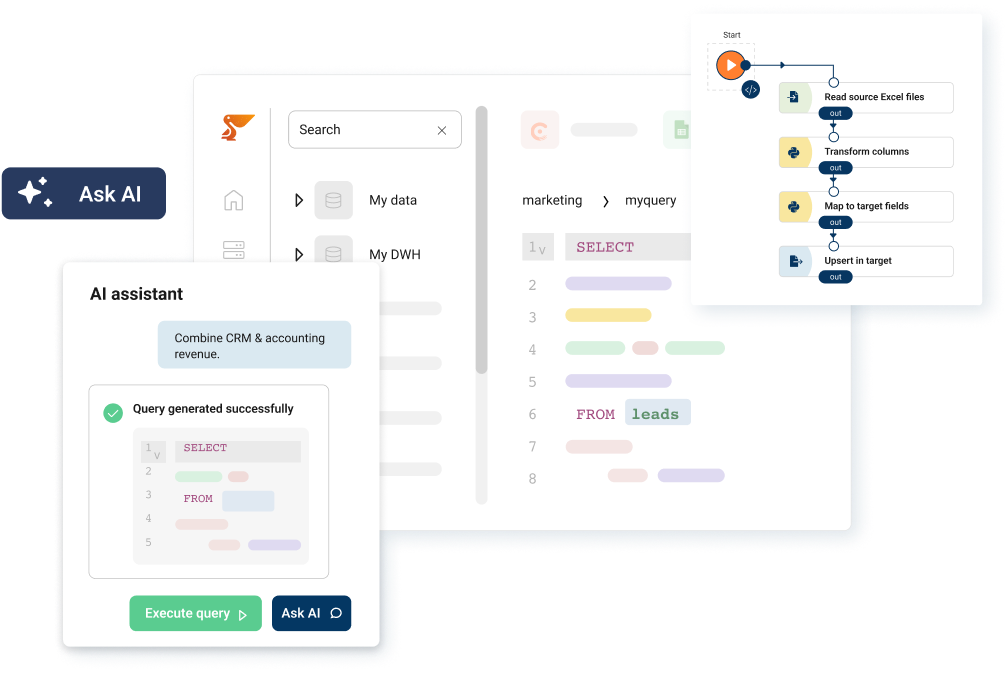
Peliqan also connects your AFAS data to AI assistants via an MCP server. The AFAS AI data integration lets users ask plain-language questions – “What’s our total payroll cost this month by department?” or “Which projects are currently over budget?” – and receive answers directly from the warehouse without building a Power BI report. For operational teams who need ad-hoc answers rather than fixed dashboards, this is a significant time saver.
Beyond interactive queries, you can build AI agents that run scheduled AFAS data checks and proactively deliver results to Slack or email – for example, alerting your finance team automatically when any project crosses its budget threshold or when payroll cost variance exceeds a defined threshold.
Pricing starts at ~$199/month, which includes the AFAS connector, the built-in warehouse, and access to 250+ other connectors. There is no separate charge for adding BI tool connections, running transformations, or accessing reverse ETL. Full details on what’s included are on the AFAS connector page.
Conclusion
AFAS Profit holds some of the most operationally important data in Dutch-market organisations – payroll runs, HR records, project hours, general ledger entries. Getting that data into Power BI reliably has always required more effort than AFAS’s native tooling suggests, and the Qlik-to-Power BI transition that completed in December 2025 has pushed tens of thousands of organisations to find a better solution faster than they’d planned.
The native OData connector is a reasonable starting point for simple, single-module dashboards. It’s free, it works with Power BI Desktop, and AFAS’s standard templates cover the most common HR and revenue views. But it has a hard ceiling – twice-daily refresh, 10,000-row queries, gateway authentication problems – that makes it unsuitable for organisations with serious cross-module reporting needs or growing data volumes. Just as Odoo customers have moved to a warehouse-first approach for Power BI reporting when their native connector hit similar limits, AFAS customers face exactly the same architectural decision.
For organisations rebuilding their reporting layer after the Qlik shutdown – or those who have been stuck with static Power BI templates for months – it’s worth evaluating whether a data platform like Peliqan can replace what Qlik used to provide, at lower total cost and with far more flexibility. The ability to query AFAS data directly with SQL, combine it with other business systems, and connect any BI tool to the same governed warehouse is a significant step up from what the OData connector can offer. If you’re ready to move beyond the limitations, start with the AFAS connector on Peliqan and connect your first data source in minutes.