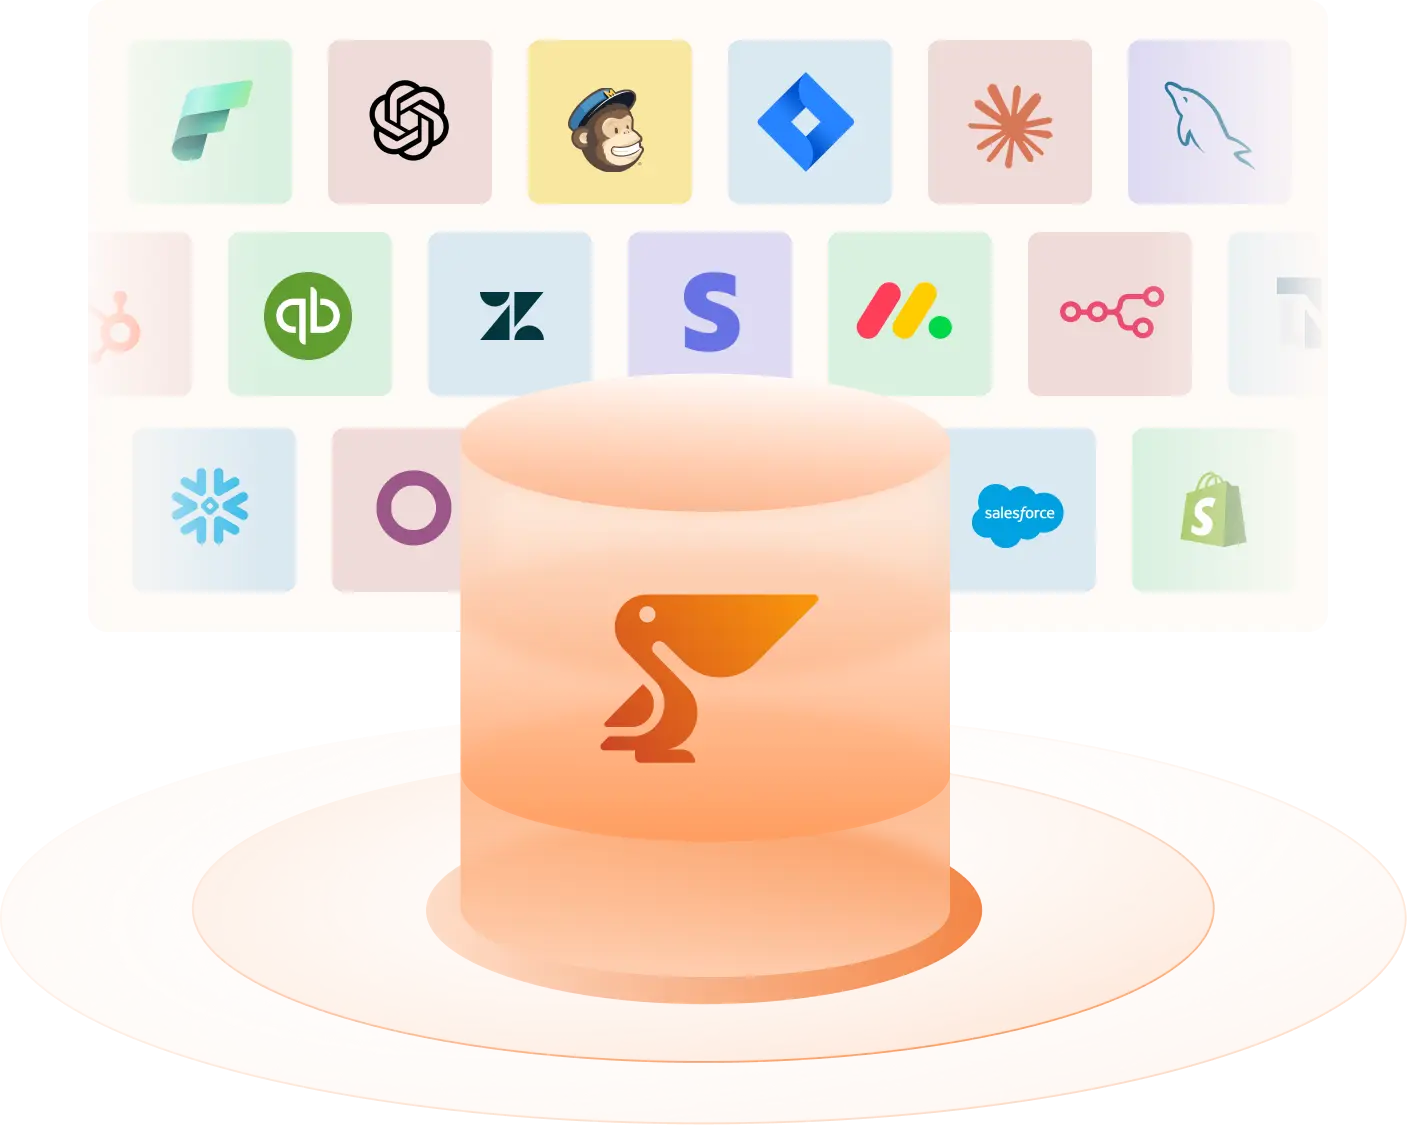


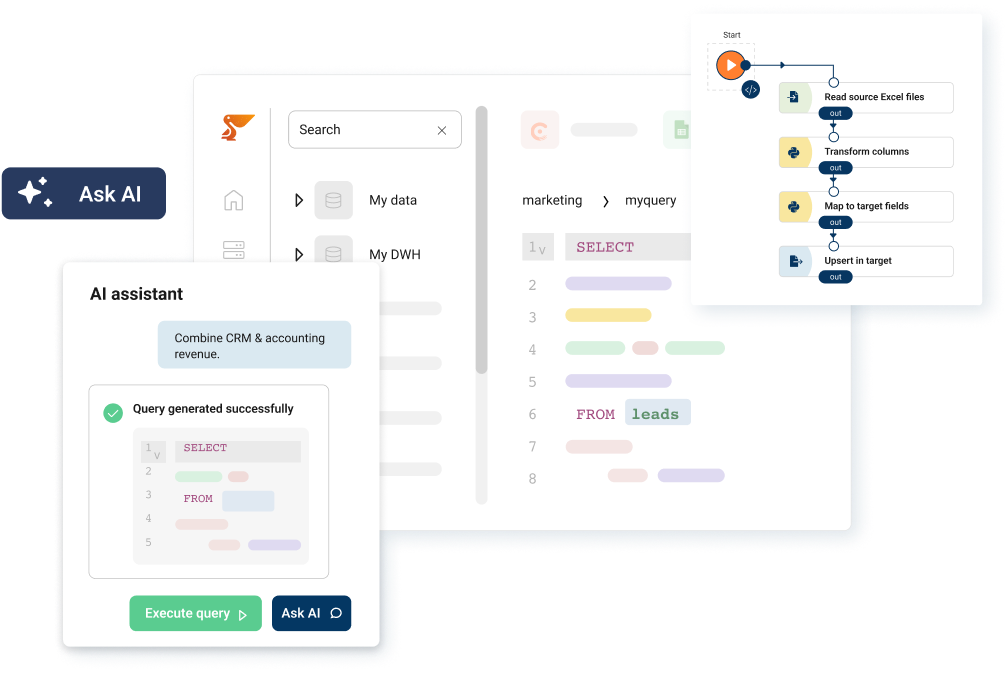


A semantic layer sits between your modelled tables and everything that reads them. It is where a metric is defined once, so a dashboard, a SQL query and an AI agent asking the same question get the same answer. The diagram below shows the shape: many sources in, one definition, many readers out.
What actually lives in the layer
- 1Metric definitions. Revenue, active customer, churn – written once, with the filters and the time grain that make them mean something. This is the part people think of first, and the part that causes the arguments when it is missing.
- 2Join paths between the tables. How orders relate to customers, and which direction is safe to aggregate over. Encoding this centrally is what stops a well-meant join from double-counting revenue.
- 3Access rules, applied at query time. Which rows a role may see, enforced when the question is asked rather than by keeping a separate filtered copy for each team.
- 4Descriptions an AI can read. Plain-language meaning attached to the model. An agent that can read what a column means picks the right one; an agent that cannot will confidently pick a wrong one.
Why it matters more now than it did five years ago
When only analysts wrote queries, an undefined metric produced an argument in a meeting. Now that agents query the same tables in natural language, an undefined metric produces a confident wrong answer at machine speed and nobody sees the SQL. The semantic layer is what turns ‘the model guessed’ into ‘the model used the definition’.
Semantic layer, metrics layer, or headless BI?
The terms overlap. A metrics layer is usually the narrower idea – just the measures. A semantic layer normally includes joins, access and descriptions as well. Headless BI describes serving those definitions over an API to any front end. In practice you are choosing where the definition lives, not which word to use for it.
Where it sits in a warehouse
In a classic three-tier warehouse this is tier 2, between storage and consumption – the layer teams skip and then rebuild after the first meeting where two numbers disagree. That position is drawn out on our data warehouse architecture diagram.
What this looks like in Peliqan
Models built in Peliqan with SQL or Python become the shared definition that BI tools, ad-hoc queries and agents over MCP all read, so the same rules and the same access control apply whichever way the question arrives.
Use this diagram wherever you like
The diagram is free to use, including commercially, as long as there is a visible link back to this page. Download the PNG for slides and documents, or the SVG if you want to edit the labels. No email required. You can browse the rest of the set in the Peliqan diagram library.
Ready to build this on your own data? Get started with Peliqan.