



A data mart is a subset of analytical data scoped to one team. A data warehouse is the conformed model the whole organisation shares. The question that decides everything is where the mart gets its data from, and the diagram below shows both answers.
The two ways to build a mart
- 1Dependent marts are built from the warehouse. Sources land in the warehouse, the warehouse holds one conformed model with its history, and each mart is a subset of it for one team. Because every mart descends from the same model, the numbers agree by construction.
- 2Independent marts are built straight from source. Each team extracts what it needs directly. Faster to stand up, and the reason three teams end up with three revenue figures: there is no shared model between them and nothing to reconcile against.
How a mart differs from a warehouse
- Scope: a warehouse spans the organisation; a mart covers one department or subject area.
- Users: a warehouse serves everyone including data teams; a mart serves one team’s questions.
- Design: a warehouse keeps history and stays reusable; a mart is shaped for the questions its team asks most.
- Build time: a mart is quicker, which is precisely why independent ones proliferate.
Do you still need marts?
Less often than you did. Marts existed partly because querying the full warehouse was slow or expensive, and cloud warehouses have largely removed that constraint. What survives is the useful part: a curated, well-named subset that a team can query without understanding the whole model. Built as a view on the warehouse rather than a separate copy, that is a mart with none of the drift.
Where marts sit in the architecture
In a classic layout the marts sit alongside the warehouse in tier 1, which is drawn on our data warehouse architecture diagram. What stops two marts disagreeing is a shared semantic layer.
What this looks like in Peliqan
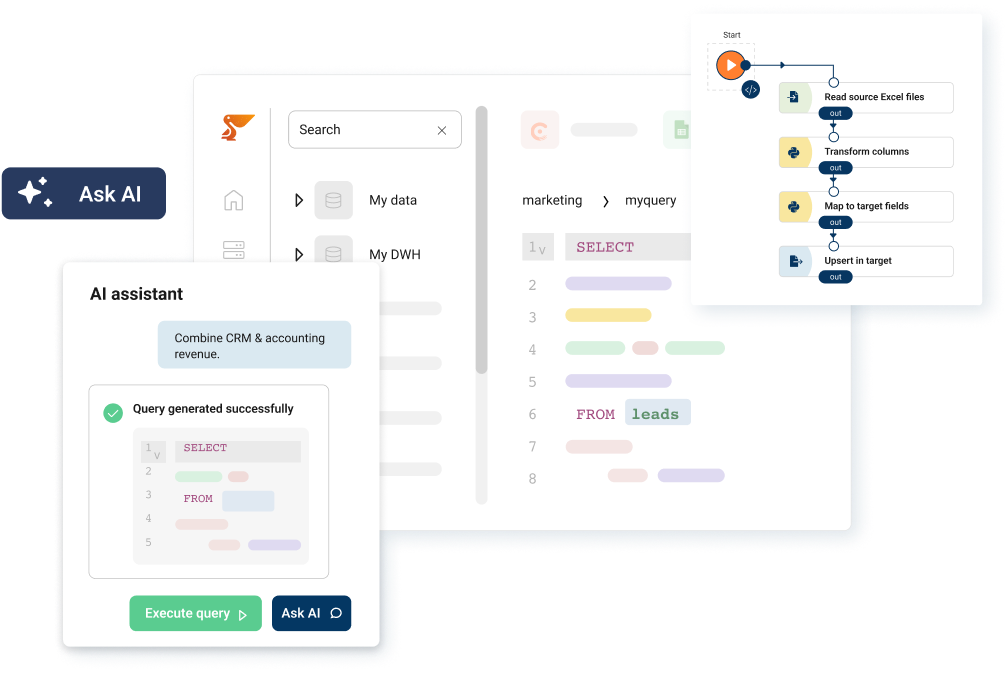
Data from 300+ sources lands in one warehouse, and team-level marts are built as models on top of it in SQL or Python – dependent by default, so a subset stays a subset rather than becoming a second version of the truth.
Use this diagram wherever you like
The diagram is free to use, including commercially, as long as there is a visible link back to this page. Download the PNG for slides and documents, or the SVG if you want to edit the labels. No email required. You can browse the rest of the set in the Peliqan diagram library.
Ready to build this on your own data? Get started with Peliqan.