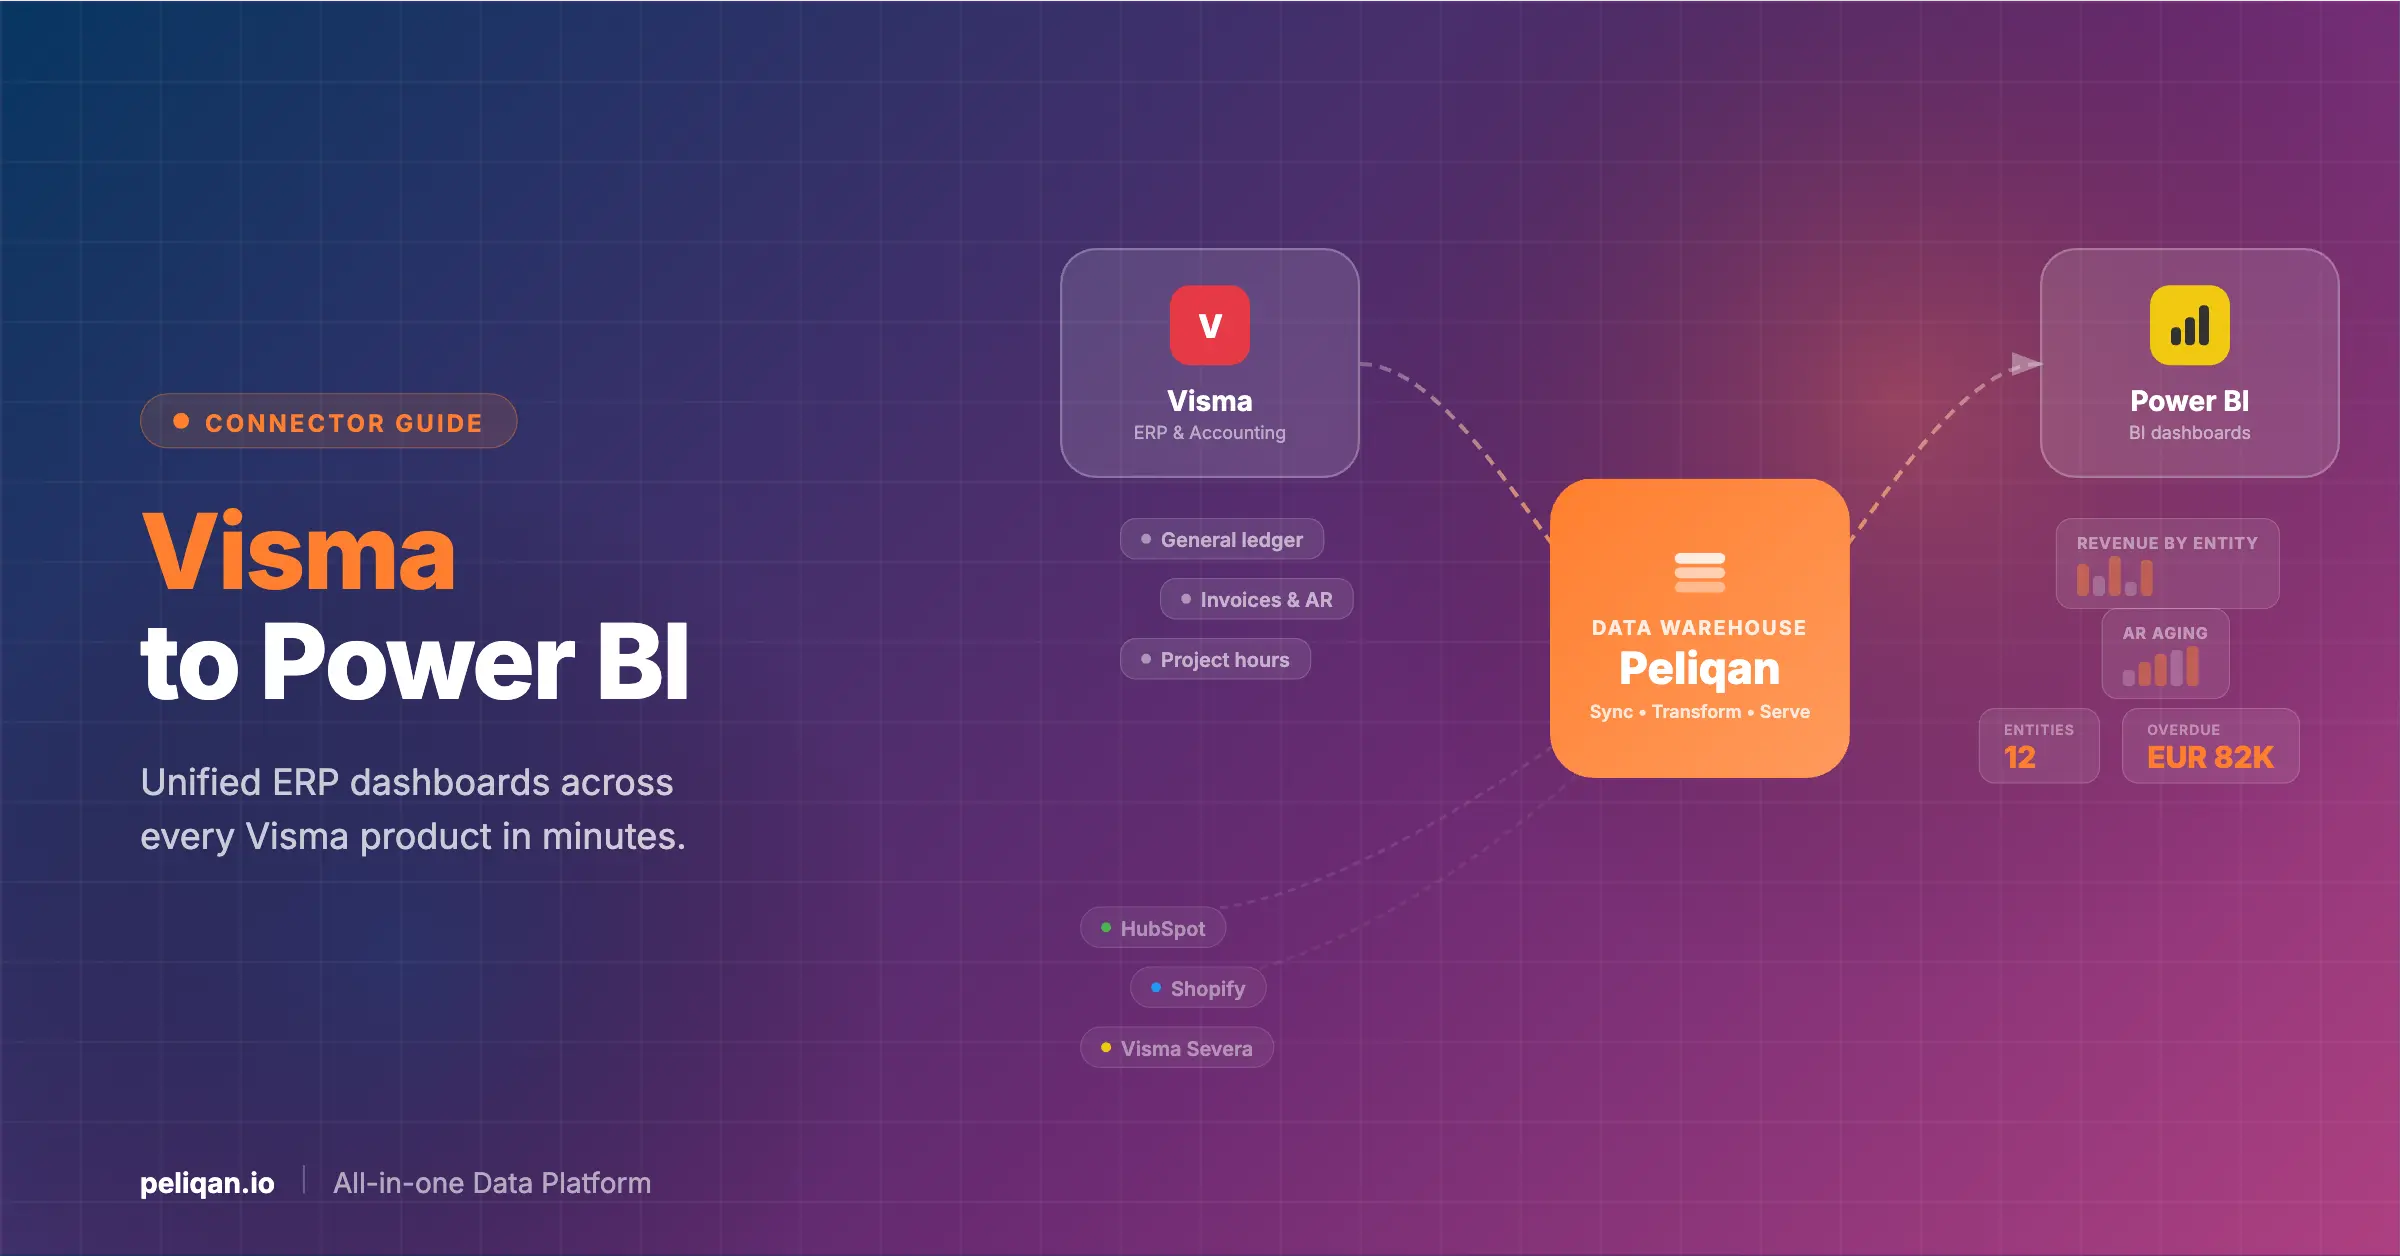





Visma to Power BI sounds like it should be straightforward – both are enterprise-grade platforms, Visma has APIs, and Power BI supports hundreds of connectors. But anyone who has actually tried to build a cross-entity Visma dashboard in Power BI knows the reality is messier than the marketing suggests.
Visma is one of the largest software companies in Europe, serving 2.4 million customers across 33 countries with a product portfolio that spans ERP, accounting, payroll, HR, and procurement. Revenue hit EUR 2.8 billion in 2025, and the company is preparing for a London Stock Exchange IPO in 2026 at an estimated valuation of around EUR 20 billion. If your organization runs on Visma, your financial and operational data lives inside one of its many products – Visma.net ERP, Visma eAccounting, Visma e-conomic, Visma Business, or Visma Severa.
The challenge is getting that data into Power BI in a way that actually supports real analytics – not just a flat export or a handful of pre-built charts. This guide walks through the practical options, from direct API connections to the data warehouse approach, so you can pick the method that fits your reporting needs.
What data lives in Visma
Visma’s product family covers a wide range of business data, and the specific tables available depend on which Visma product you use. Across the portfolio, the most common data types include general ledger entries and journal postings, accounts receivable and accounts payable balances, customer and supplier master records, purchase orders and sales orders, invoice lines with tax breakdowns, project time entries and billable hours (particularly in Visma Severa), payroll records and employee data, and bank reconciliation transactions.
The granularity matters. Visma.net ERP exposes detailed financial dimensions and multi-company structures, making it the most complex but also the most powerful source for enterprise reporting. Visma eAccounting focuses on small-business accounting with simpler data models – fewer endpoints, but enough for most SMB reporting needs. Visma e-conomic serves the Danish and Nordic market with deep invoicing and bookkeeping data, and has its own distinct API ecosystem.
Each product has its own API and its own data schema, which is the first complication when trying to build a unified Power BI dashboard. A holding company running Visma.net for the parent entity and Visma eAccounting for smaller subsidiaries will find that the data structures do not align out of the box – field names differ, chart of accounts schemas diverge, and authentication mechanisms are completely separate.
Why connecting Visma directly to Power BI is harder than it looks
Common pain points with direct Visma-to-Power BI connections
The third-party connector options – Invantive Bridge, BI Book, ELA Analytics – solve the basic connectivity problem but introduce their own limitations. Most offer read-only access to a subset of Visma tables, provide limited transformation capabilities, and add another subscription cost to your stack. For simple single-entity reporting, they work. For cross-product or multi-company analytics, you will outgrow them quickly.
The data warehouse approach to Visma reporting
Rather than pointing Power BI directly at a Visma API, the more robust approach is to replicate Visma data into a central data warehouse first. This decouples your reporting layer from your source system and gives you a clean, query-optimized dataset to build dashboards on.
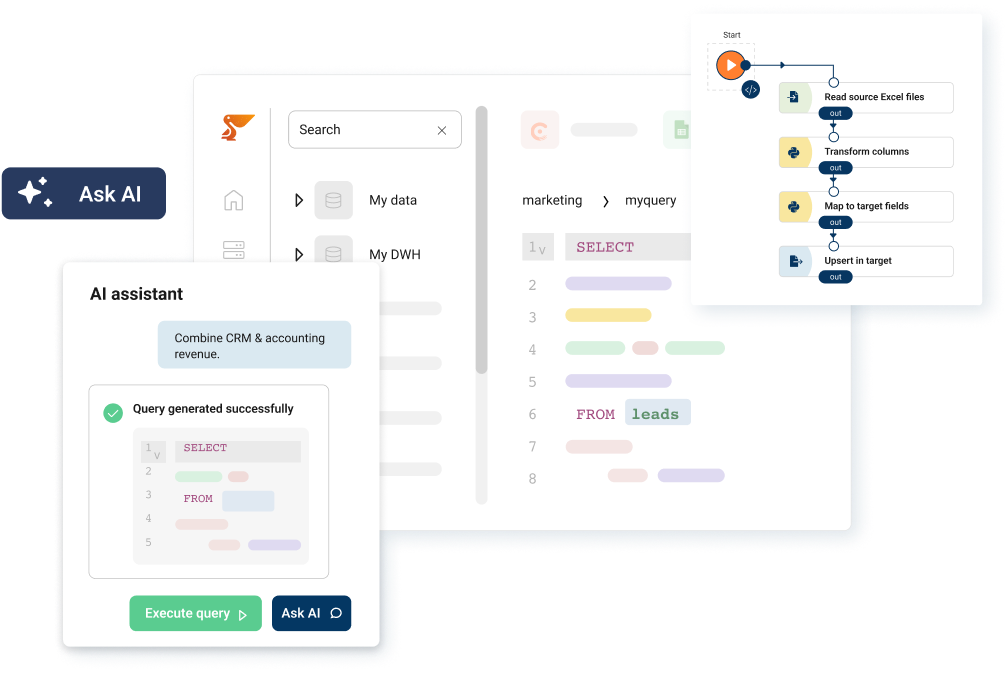
How Peliqan connects Visma to Power BI
The warehouse approach also means you are not limited to Visma data alone. If your organization uses HubSpot for CRM, Exact Online for a subsidiary’s books, or Shopify for e-commerce, you can land all of those into the same warehouse and build cross-source Power BI reports.
Example: consolidated Visma reporting in SQL
Once your Visma data is in the warehouse, you can run SQL queries that would be impossible through the Visma UI or a direct API connector. For example, a monthly revenue breakdown with receivables aging:
SELECT
  DATE_TRUNC('month', invoice_date) AS month,
  SUM(amount)                       AS total_revenue,
  SUM(CASE WHEN due_date < CURRENT_DATE AND paid_date IS NULL THEN amount ELSE 0 END) AS overdue_receivables, COUNT(DISTINCT customer_id) AS active_customers FROM visma_net.invoices WHERE invoice_date >= DATE_TRUNC('year', CURRENT_DATE)
GROUP BY 1
ORDER BY 1;
This kind of query runs directly against your materialized warehouse tables – no API calls, no rate limits, no pagination issues. Power BI picks up the results instantly.
Skip Power BI entirely – query Visma data with AI
Not every question needs a dashboard. With MCP (Model Context Protocol), you can connect Visma data to AI assistants like Claude or ChatGPT and ask questions in plain English. Peliqan provides an MCP server that connects to your Visma data through the same warehouse sync.
Once set up, you can ask questions like:
- “What is our total outstanding receivables across all Visma entities?”
- “Which customers have invoices overdue by more than 60 days?”
- “Compare this quarter’s revenue to the same quarter last year”
- “Show me the top 10 expense categories by spend this month”
The AI agent queries your warehouse directly, so you are always working with the same governed, quality-checked data your Power BI dashboards use. For finance teams fielding ad hoc questions from leadership, this eliminates the cycle of “can you pull this number” requests that interrupt deeper analytical work. You can learn more about how MCP works with Peliqan in the documentation.
Four ways to connect Visma to Power BI compared
Combine Visma with other data sources in one dashboard
Most organizations running Visma are not running Visma alone. A typical Nordic or European mid-market company might use Visma.net for core financials, HubSpot or Salesforce for CRM, Shopify or WooCommerce for e-commerce, and separate HR or payroll tools. The real power of the warehouse approach is that you can combine Visma with Power BI alongside data from any of those sources.
With Peliqan’s 250+ connectors and a two-week SLA for any custom connector not yet in the catalog, you can build a single Power BI dashboard that shows financial data from Visma, pipeline data from your CRM, and order data from your e-commerce platform – all joined on shared keys like customer ID or product SKU. This is particularly relevant for Visma customers because the Visma ecosystem itself is fragmented across products. A company might run Visma.net for financials, Visma Severa for project management, and a non-Visma CRM for sales – the warehouse is the only place where all three datasets can meet.
Peliqan also supports connecting to on-premises databases and legacy systems through its hybrid connectivity options, which matters for organizations that still maintain local Visma Business installations alongside their cloud Visma products.
Real-world example: CIC Hospitality
CIC Hospitality consolidated 50+ data sources into a single reporting layer using Peliqan, saving 40+ hours per month on board report automation. Their finance team now gets cross-property financial dashboards without manual Excel consolidation. Read the full case study.
Getting started
If you are ready to connect Visma to Power BI through a data warehouse, you can start with Peliqan’s Visma.net connector or the Visma e-conomic connector depending on which product you use. Setup takes minutes, not weeks. Pricing starts at around $199 per month, and you get the warehouse, transformations, BI connectivity, and AI querying included in a single platform.