

MCP Inspector is the official tool for testing and debugging MCP servers. With it, you connect to a server, see its tools and call them by hand. You can also read every message that goes back and forth. This guide covers version 2, which works quite differently from the version 1 tutorials you may find elsewhere. All commands below match Inspector 2.16.0, released on 18 November 2026.
The short answer
MCP Inspector is a free, open-source developer tool from the Model Context Protocol project. You start it with one command, npx @modelcontextprotocol/inspector. It then opens a web page where you can connect to any MCP server. From there, you can list and call tools, read resources, try prompts and watch the raw messages.
Version 2 also adds a command-line client for scripts and CI, and a terminal UI. It also needs a recent Node.js release: 22.23.4, 24.22.1 or 26.12.1 and later.
What MCP Inspector is (and is not)
An MCP server exposes tools, resources and prompts to AI apps such as Claude or ChatGPT. So when you build or connect one, you need to check that it answers correctly before an AI relies on it. The Inspector does that job. You drive it by hand as an MCP client, so you see what the server offers and how it responds.
It is not an AI assistant, though. The Inspector never decides which tool to call; you do. For example, it answers questions such as “does my server start?”, “is this schema right?” or “why does login fail?”. For the basics of servers themselves, see our guide on how to build an MCP server.
What changed in version 2
Version 2 is a rewrite. The package name and the main command stayed the same, but much of what older tutorials describe has changed. Version 1 still runs, but the project treats it as deprecated and only ships security fixes for it. If an old setup still needs it, you can run it with npx @modelcontextprotocol/inspector@v1-latest.
Two changes catch most people out. First, --config now opens a server file read-only, while the new --catalog flag points to a file the Inspector can edit. Second, a failing tool call now exits with code 5. As a result, CI scripts copied from version 1 that ignored failed calls will start to fail. That is the correct behaviour, though.
How to install and launch MCP Inspector
There is nothing to install, because the Inspector runs through npx, which comes with Node.js. So start by checking your Node version with node -v.
On an unsupported release, such as Node 25, npm prints an EBADENGINE warning. The tool may still start, but nothing guarantees it keeps working. Instead, you can pin a supported Node for a single run. This command downloads Node 24 for that run only and leaves your installed Node alone:
npx -y -p node@24 -p @modelcontextprotocol/inspector -- mcp-inspector
Inspect a local server
Most servers in development run locally over standard input and output (stdio). In that case, put the command that starts your server after the Inspector command:
# Your own server
npx @modelcontextprotocol/inspector node build/index.js

# The MCP project's test server, with example tools, resources and prompts
npx @modelcontextprotocol/inspector npx -y @modelcontextprotocol/server-everything

# A Python server from PyPI
npx @modelcontextprotocol/inspector uvx mcp-server-git --repository ~/code/my-repo
Also, if your server needs environment variables, pass them with -e KEY=value before the server command. Always read a server’s own README first, though, because every server takes different arguments.
Inspect a remote server
For a server on the web, use --server-url with the HTTP transport:
npx @modelcontextprotocol/inspector --server-url https://example.com/mcp --transport http
Here, http means Streamable HTTP, the current standard transport for remote servers. The Inspector also picks it on its own when the URL ends in /mcp, so the flag matters most for other addresses. Use the value http, though, not streamable-http, which the CLI rejects as an invalid transport type.
Without any server in the command, the Inspector opens with your saved server list instead. There, you can add servers by hand. The official MCP Inspector documentation lists every launch option.
A walk-through of the web UI
When the web UI starts, the terminal prints a local address such as http://127.0.0.1:6274, with a one-time token in the link. Then it opens that link in your browser. That token stops other pages on your computer from using the Inspector, so never share the link. To keep the browser from opening by itself, set MCP_AUTO_OPEN_ENABLED=false.
Next, connect. Each server appears as a card that shows its transport, such as standard I/O, and a switch to connect it. Once connected, the card also shows the protocol version both sides agreed on. However, if you started the server from the command line, you cannot edit the list. In that case, start the Inspector with no server or with --catalog to keep an editable list.
Tools, resources and prompts
Most testing happens in the Tools tab. Pick a tool, fill in its inputs and then select Execute Tool. The result then appears next to the form, together with the time the call took. The panel also shows the tool’s annotations, such as read-only or idempotent. You can also switch the input form to raw JSON.
Every run also lands in a history list, so you can re-run a call or tick two runs to compare them. There is even a Load test button for repeated calls. For what happens when a server or API slows you down under load, see our MCP rate limits guide.
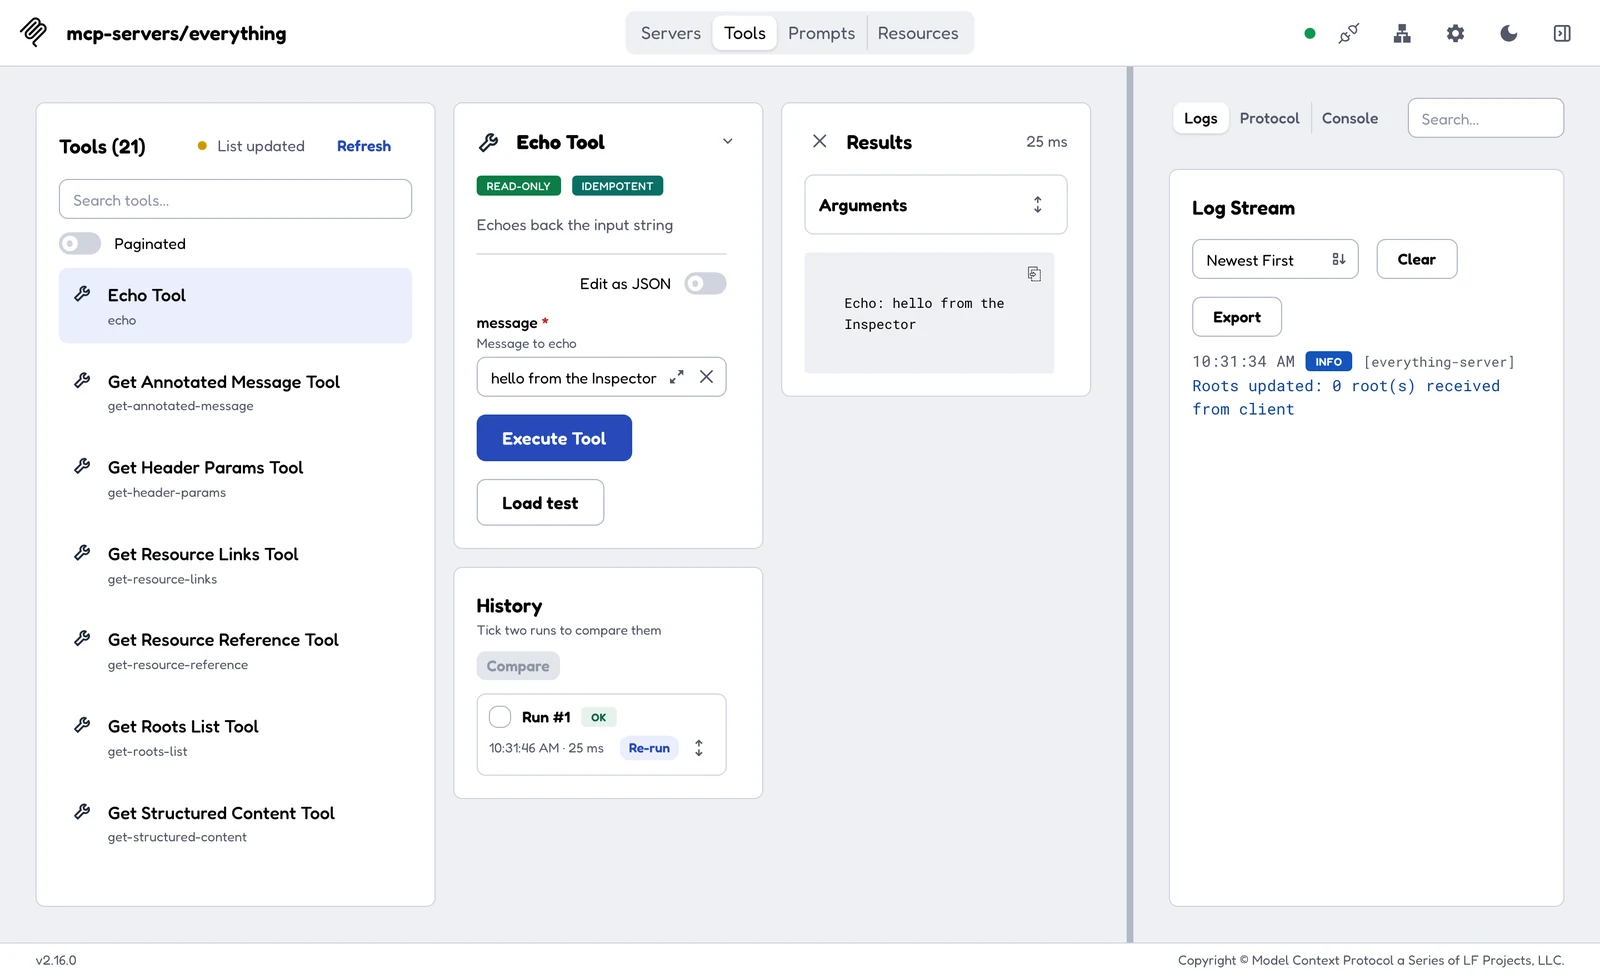
The Tools tab in MCP Inspector 2.16.0: the echo tool’s form, its result and the run history.
The Resources and Prompts tabs cover the other two MCP building blocks. Resources lists each resource and resource template, and shows a preview when you select one. Prompts lists each prompt with its description, so you can select one and check its details and arguments.
The Protocol view
The sidebar on the right has three views: Logs, Protocol and Console. Protocol helps most when something goes wrong. It lists every message in order, with its direction, method name, timing and status. You then see exactly what your server sent, rather than what you think it sent.
A badge above the list shows the protocol era. By default, the Inspector uses the older legacy handshake, so the badge reads LEGACY. To test the newer 2026-07-28 behaviour from the CLI, add --protocol-era modern.
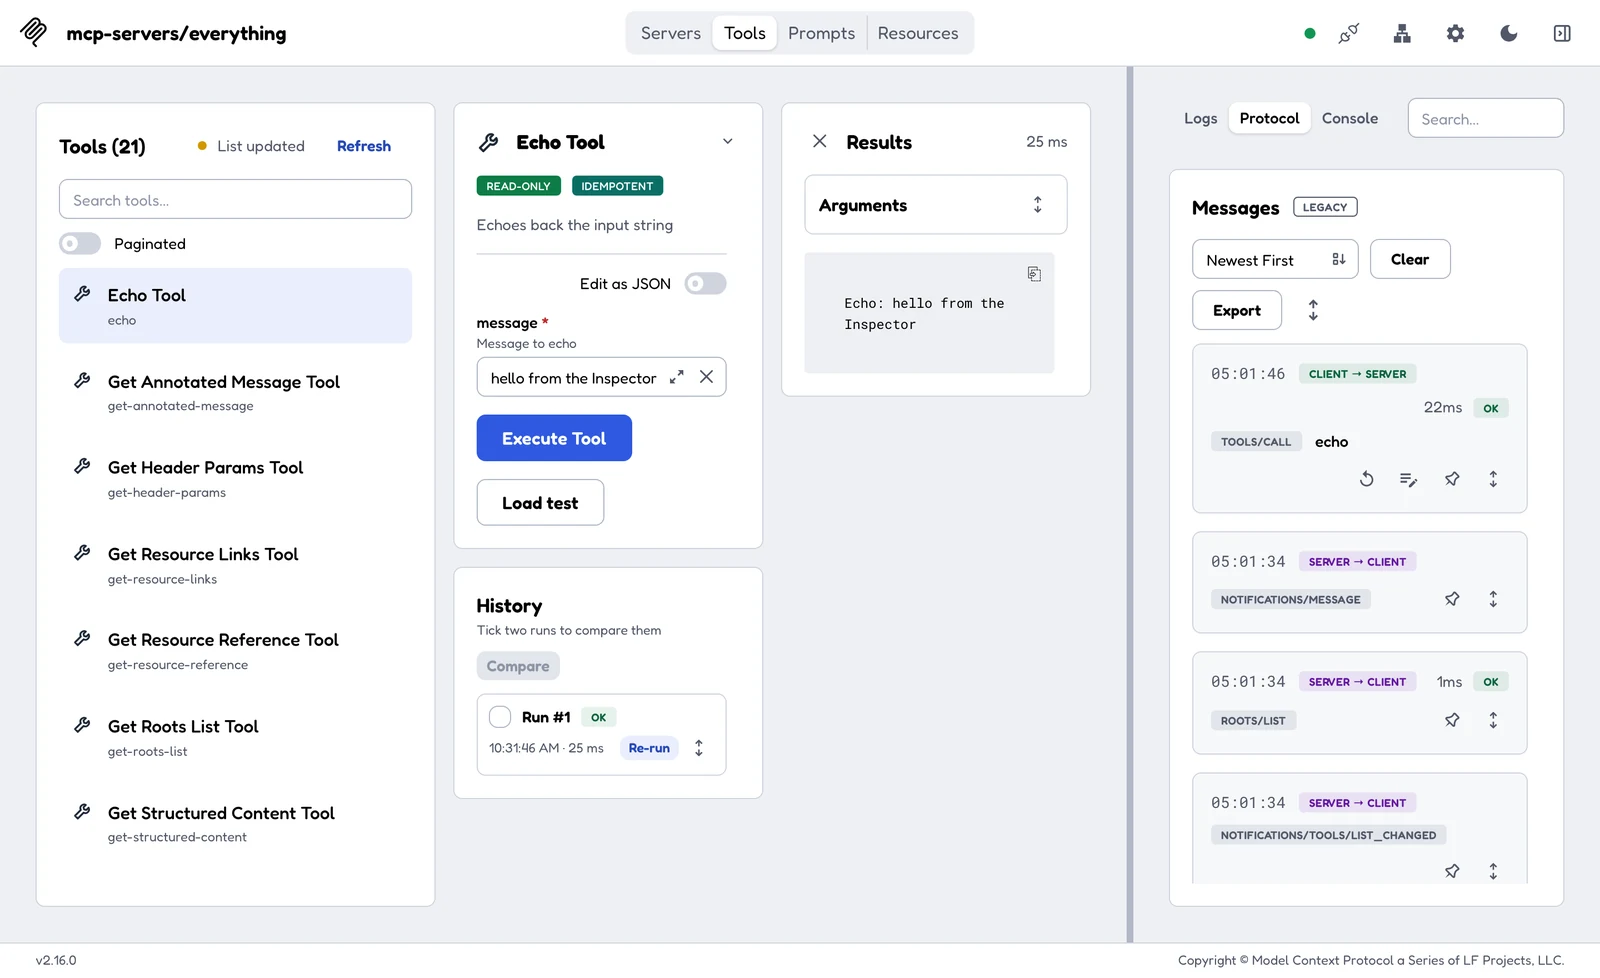
The Protocol view lists each message with its direction, method, timing and status.
Testing a server that uses OAuth
Remote servers often require a login with OAuth. The Inspector handles the whole flow for you. First, it reads the server’s authorization details and registers itself as a client. Then it opens the login page and stores the token it gets back. Our guide to MCP OAuth explains each step of that flow.
Client registration works in one of three ways, depending on the server. Many servers accept dynamic client registration, so you need nothing extra. Others expect a pre-registered client, which you pass with --client-id and --client-secret. A third option is a client ID metadata document, passed with --client-metadata-url.
After login, the authorization server sends you back to a callback address on your machine. The web UI uses http://127.0.0.1:6274/oauth/callback, while the CLI and terminal UI share http://127.0.0.1:6276/oauth/callback. If the authorization server only accepts registered addresses, register the exact one. Note that localhost and 127.0.0.1 count as different addresses. A mismatch there is also the most common reason a login fails.
The Inspector keeps OAuth tokens, client secrets and environment values in your operating system’s keychain when one exists. On a Mac, for example, the startup output confirms this with a “Secrets: OS keychain” line. On machines without a keychain, such as many Linux servers and containers, secrets go to ~/.mcp-inspector/secrets.json instead. Unless you set a key, nothing encrypts that file.
Automating MCP server tests with the CLI
The command-line client turns the Inspector into a test tool for scripts and CI pipelines. Each call connects, runs one method and exits, so you can check a server after every change.
# List the tools on a local server
npx @modelcontextprotocol/inspector --cli node build/index.js --method tools/list

# Call a tool with arguments and get clean JSON back
npx @modelcontextprotocol/inspector --cli node build/index.js \
  --method tools/call --tool-name echo --tool-arg message=hello --format json
With --format json, the output is a single JSON object with a result field and no banners. For the test server’s echo tool, it looks like this:
{"result":{"content":[{"type":"text","text":"Echo: hello"}]}}
That makes it easy to check results with a tool such as jq in a pipeline. Other methods include resources/list, resources/read, prompts/list and prompts/get.
Exit codes for CI
Version 2 returns a clear exit code for each kind of failure. Every non-zero exit also writes one line of JSON to stderr, such as {"error":{"code":"tool_not_found",...}}. So a CI step can fail on the code and still log a readable reason.
Exit code 2 also exists, but it only applies to probes of MCP App interfaces.
Protected servers need one more flag in CI, because without a terminal the CLI cannot open a login page. So it stops at once with exit code 3 and suggests --stored-auth-only. That flag reuses a token saved from an earlier interactive login and never opens a browser.
The terminal UI and mcpdo
The terminal UI brings the same features into a terminal window, with tabs for Info, Resources, Prompts, Tools, Protocol and Console. It suits remote machines over SSH, where you have no browser. Put -- before the server command when that command has its own flags:
npx @modelcontextprotocol/inspector --tui -- npx -y @modelcontextprotocol/server-everything
Without the --, the terminal UI reads a flag such as -y as its own and stops with unknown option '-y'. Inside, press ? for help and Esc to exit.
The mcpdo client is newer and still experimental. It connects to a server once and keeps that connection open. Then you can run many commands against it in a row. That helps coding agents and long debugging sessions, because each command skips the connection step. To try it, run npx -p @modelcontextprotocol/inspector mcpdo --help.
Common errors and how to fix them
Most problems with the Inspector come down to a handful of causes. The table below lists the ones you are most likely to hit, with the message you see and the fix.
If a guide tells you to open port 6277 or set MCP_PROXY_AUTH_TOKEN, it describes version 1. In that case, use the version 2 table above instead.
Security tips
The Inspector is a developer tool with real access, so use it with some care. First, a stdio server runs as a normal program on your computer, with your permissions. So only launch servers whose code or package you trust.
Second, the web UI link carries a per-launch token, so do not paste it into chats or tickets. Third, check where your secrets go on shared or headless machines, because the fallback file has no encryption by default. Our article on MCP security covers the wider risks of connecting AI apps to tools.
Testing an MCP server you build on Peliqan
Peliqan lets you build your own MCP server on top of your synced company data. You start from the MCP Server template and add tools as Python functions with the @mcp.tool() decorator. Then you publish the script as an API endpoint, which becomes the server’s address. The endpoint can check a personal API key, or log users in with OAuth.
Before you connect such a server to Claude or ChatGPT, run it through the checks in this guide. First, list its tools and check each name, description and input schema. Next, call each tool with sample inputs and compare the results with your data. Finally, open the Protocol view if a call fails. Peliqan’s guide to building a custom MCP server has the exact endpoint address and login options.
If your endpoint uses an API key, keep that key out of your shell history and CI logs. Store it as a secret instead, and pass it in through an environment variable. Peliqan also offers a ready-made MCP server for business questions on your synced data. So you only need a custom one for your own tools.
Conclusion
MCP Inspector is the quickest way to see what an MCP server really does. Use the web UI while you build, the CLI in your pipeline and the Protocol view when something breaks. Just make sure you follow version 2, because its flags, ports and exit codes differ from most older guides.
Once your server passes those checks, connect it to your AI app. That way, you already know its tools behave as expected before anyone relies on them.