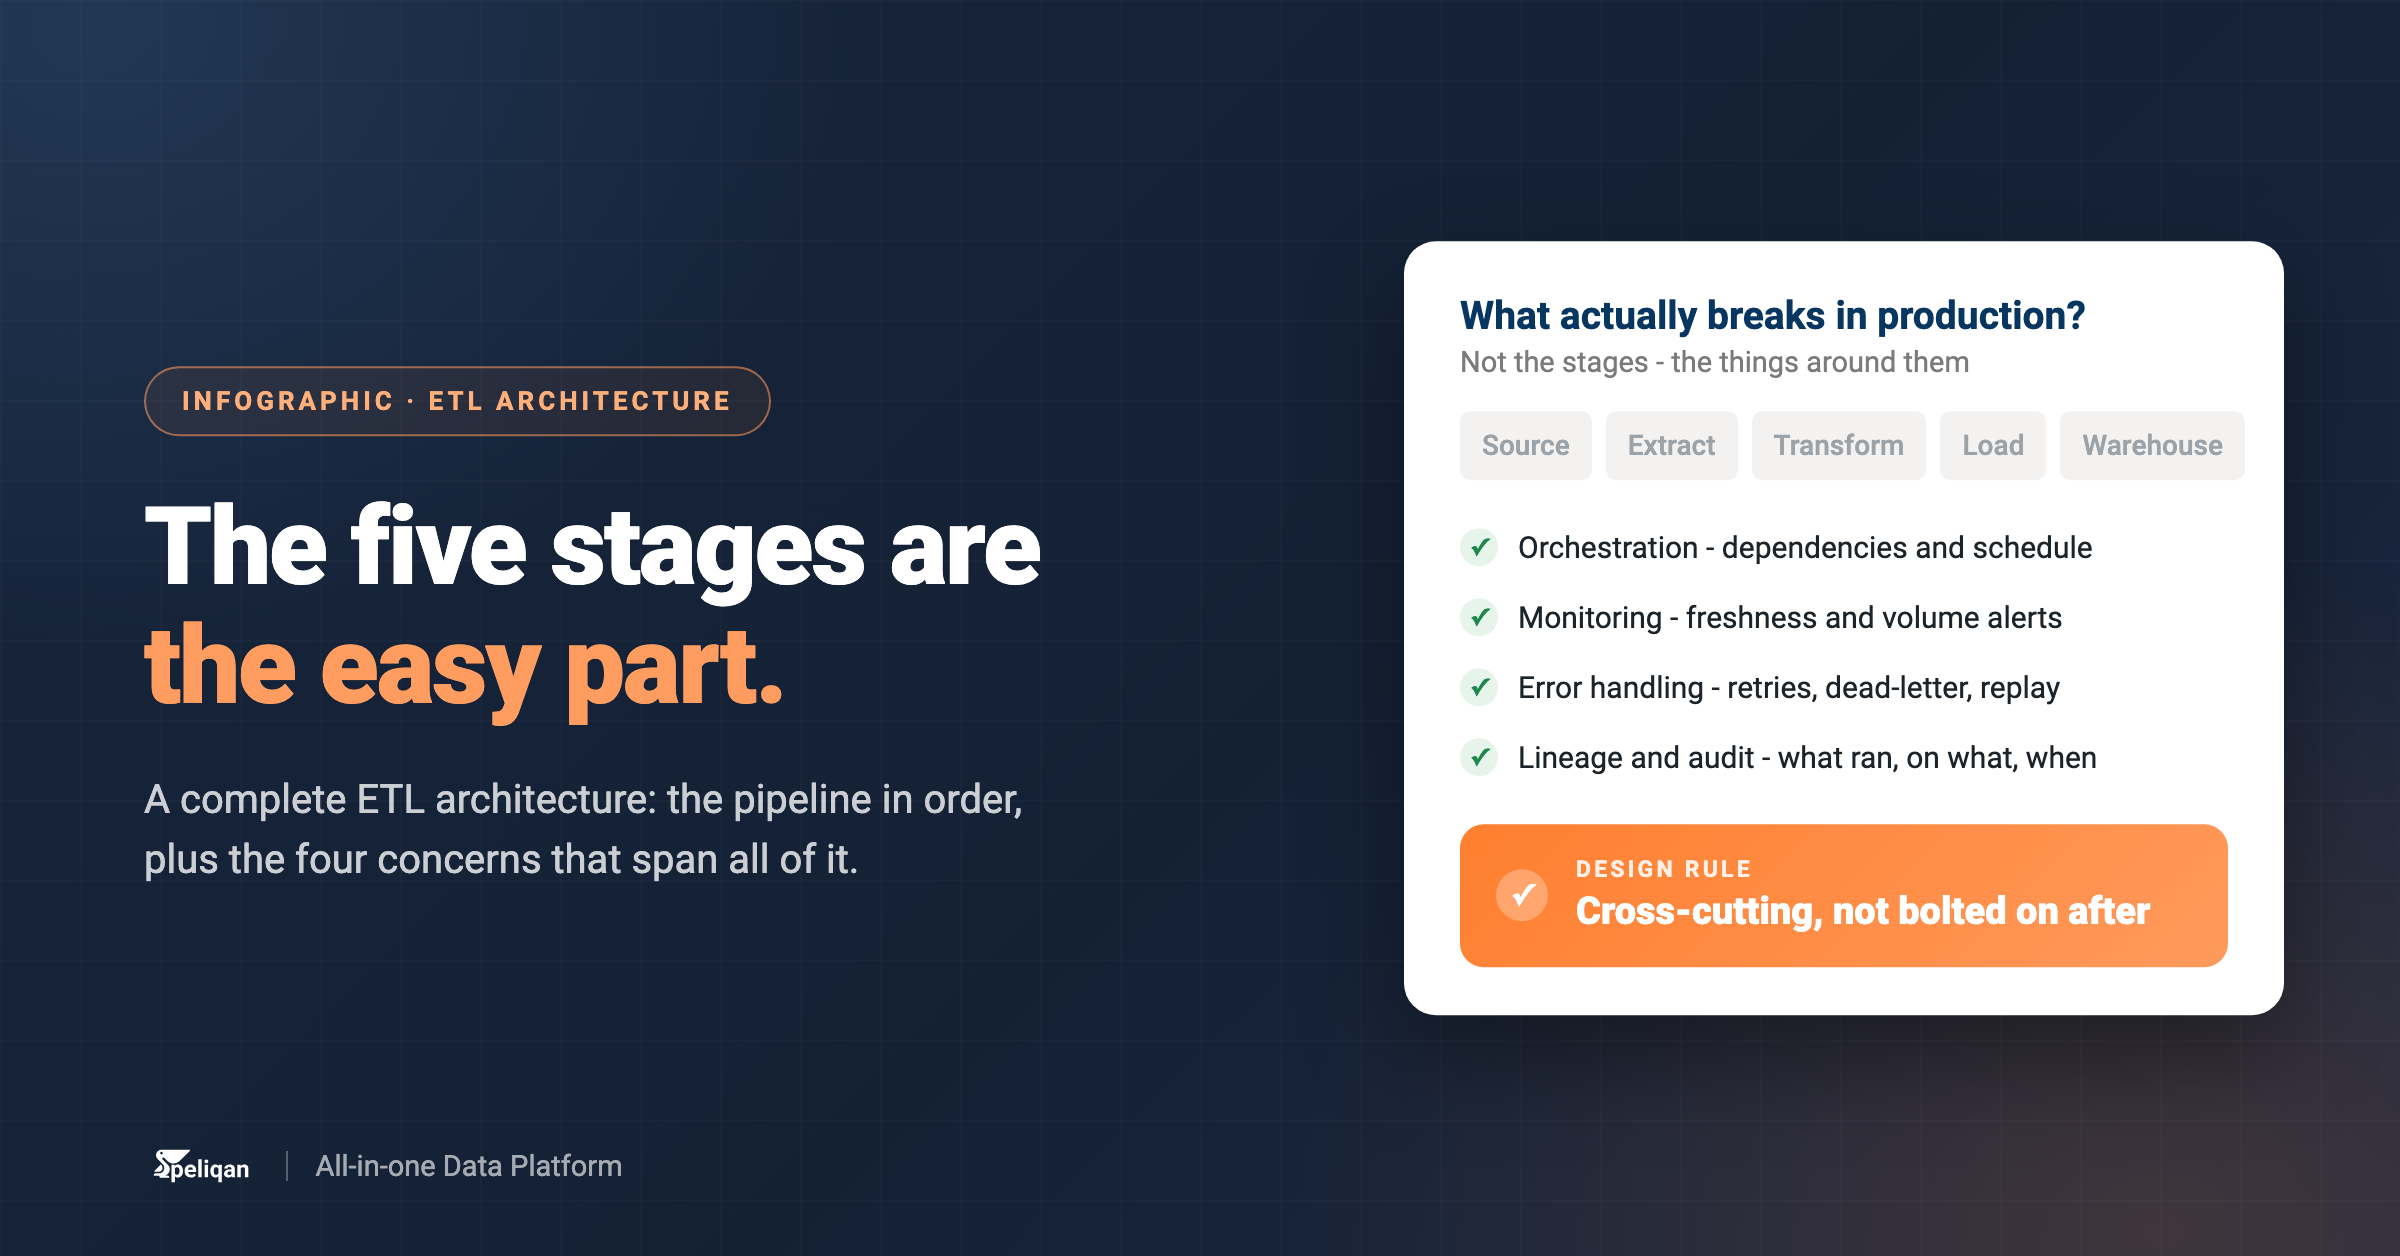



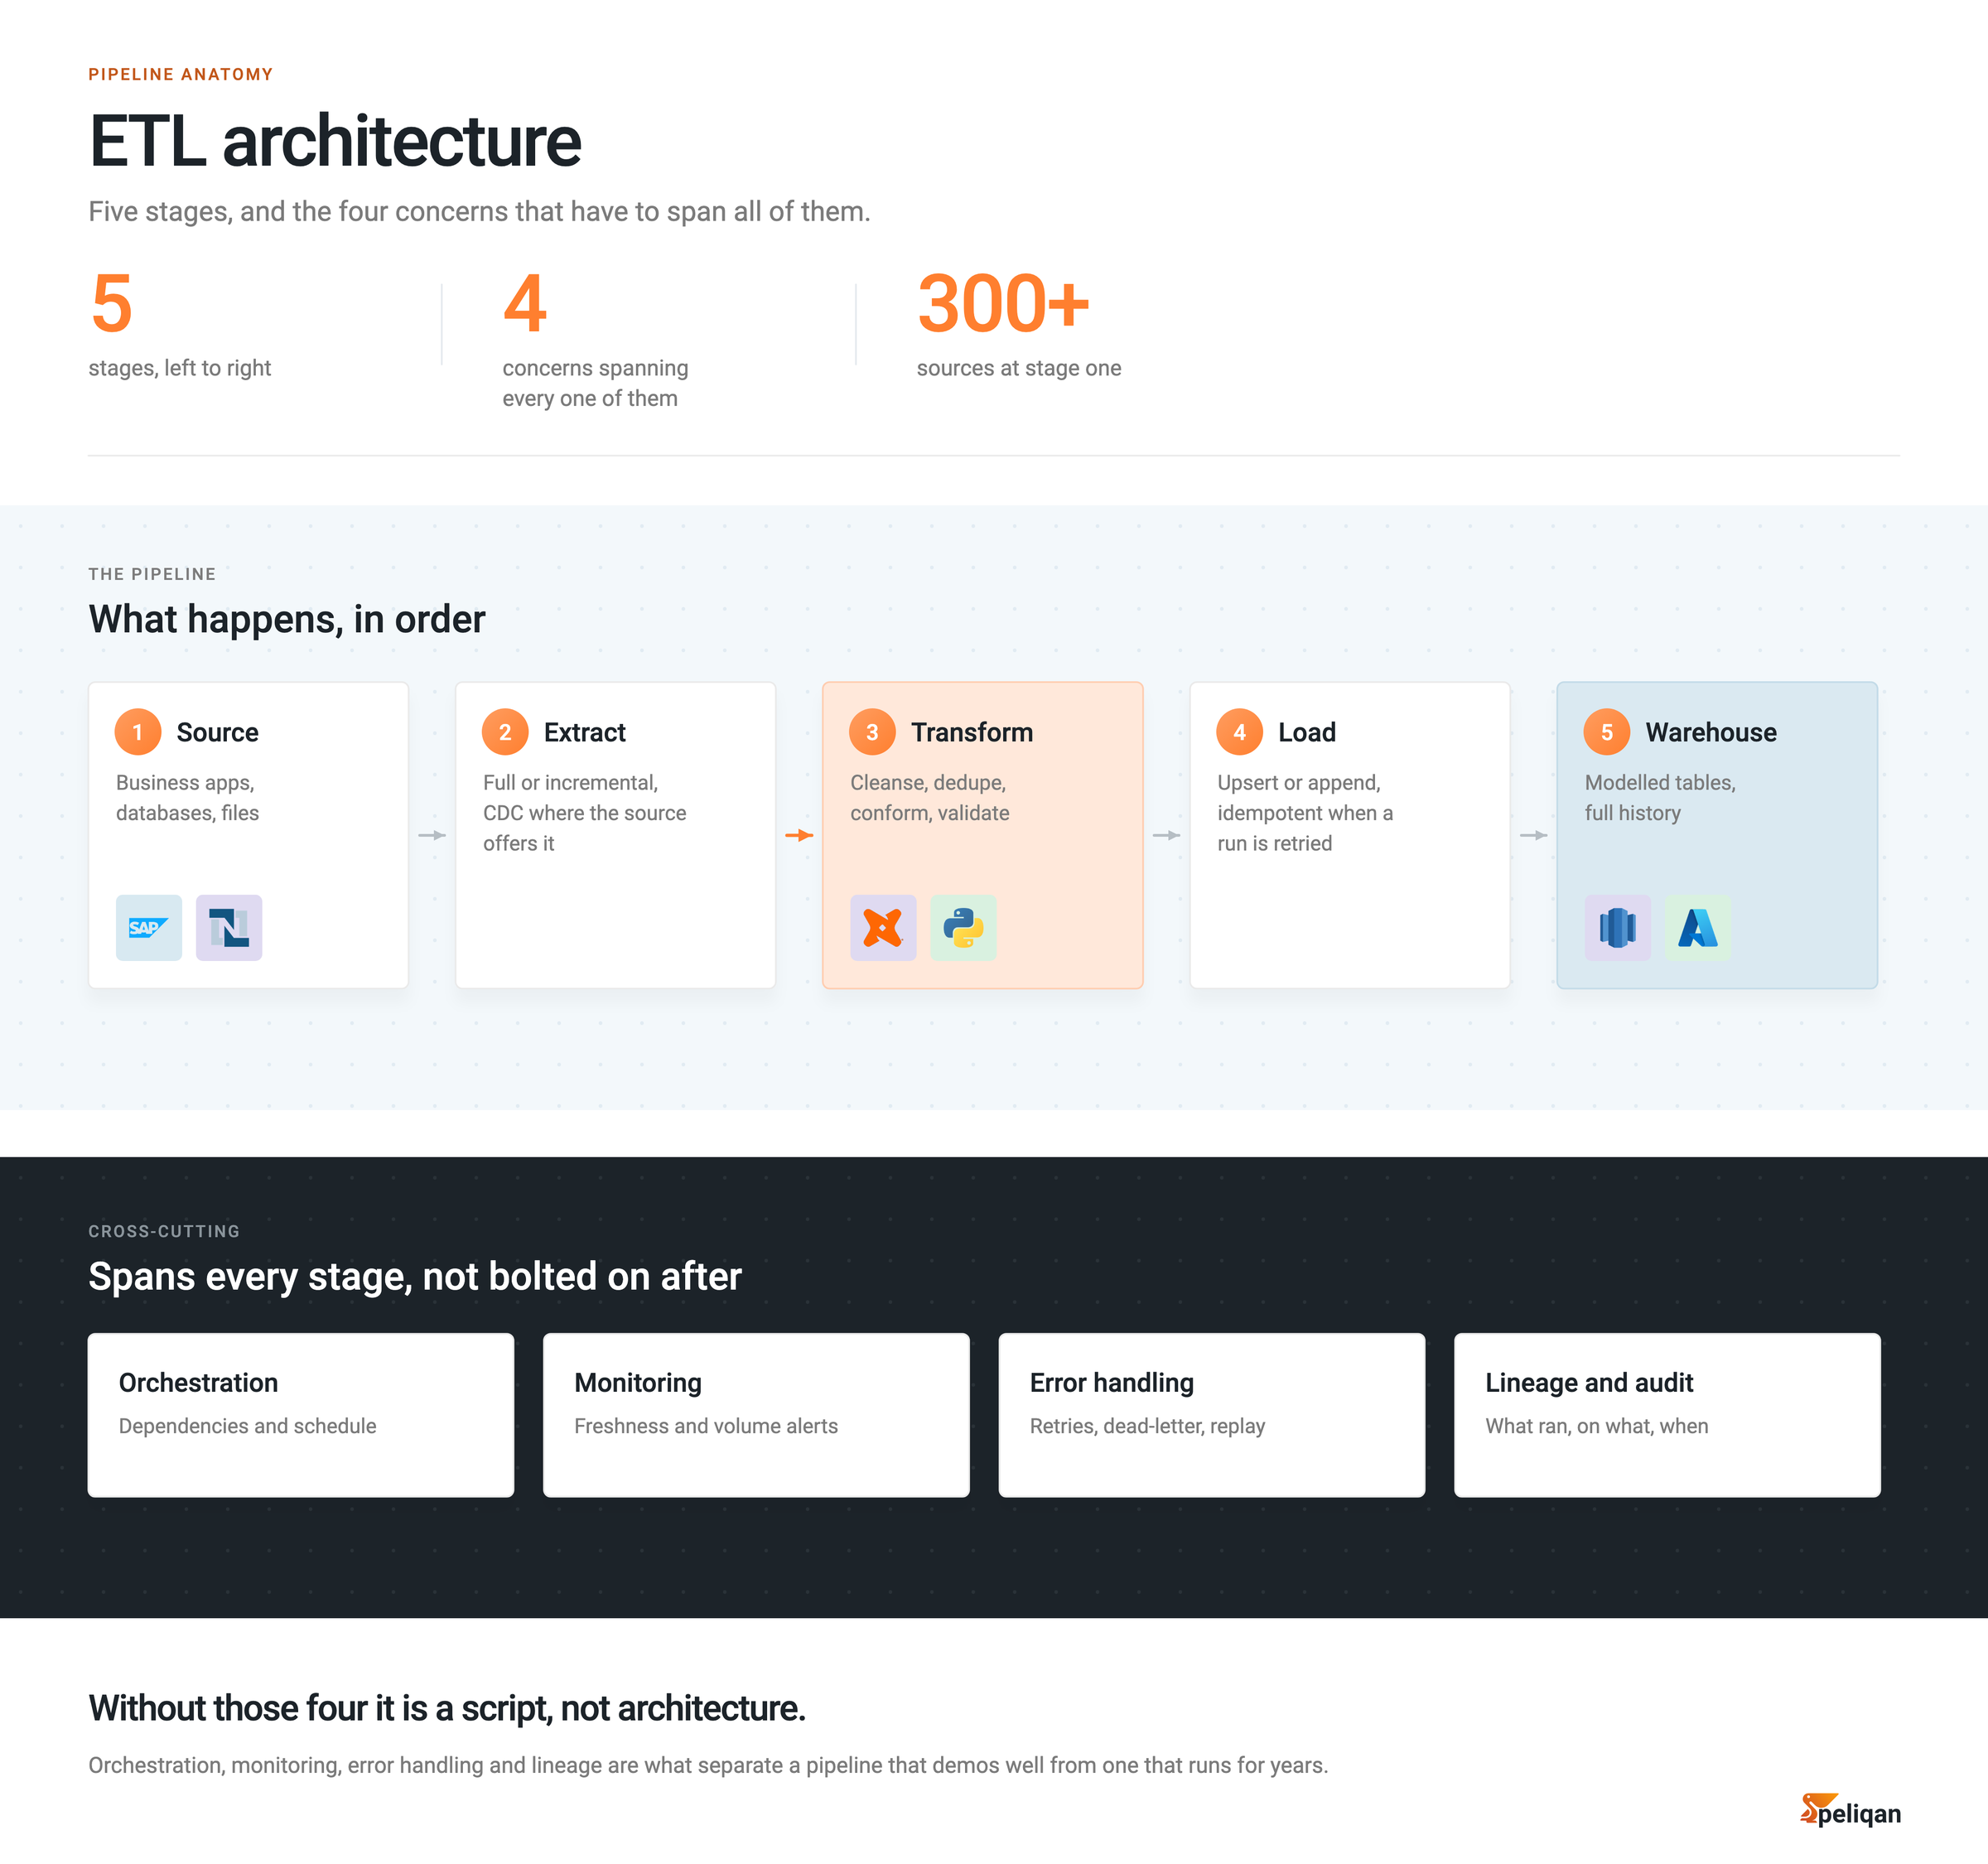
An ETL architecture diagram is usually drawn as five stages in a row. The stages are the easy part. What makes a pipeline trustworthy is the four concerns that have to span all of them, which most diagrams leave out.
The five stages
- 1Source systems. Business applications, databases and files. Each has its own API, its own rate limits and its own idea of what a customer record looks like.
- 2Extract. Full or incremental pulls, with change data capture where the source supports it. This stage has to be rate-limit aware or it will get throttled at the worst moment.
- 3Transform. Cleanse, deduplicate, conform and validate against a shared model. This is where business logic lives, and where most of the maintenance cost sits.
- 4Load. Upsert or append, handle slowly changing dimensions, and keep writes idempotent so a retry does not double-count.
- 5Warehouse. Modelled tables with full history, serving BI, applications and AI agents from one place.
The four concerns that span every stage
- Orchestration – dependencies and schedule, so stage four never runs on stage three’s stale output
- Monitoring – freshness and volume alerts, because a pipeline that silently loads nothing looks exactly like one that works
- Error handling – retries, a dead-letter path and the ability to replay
- Lineage and audit – what ran, on what, and when
In short, a pipeline without these is a script. With them it is architecture.
Where ELT changes the picture
If you load before transforming, the transform stage moves inside the warehouse and the raw layer becomes replayable. The five stages stay recognisable, but the compute bill and the recovery story both change. The two shapes are drawn side by side on our ETL vs ELT diagram.
How Peliqan handles it
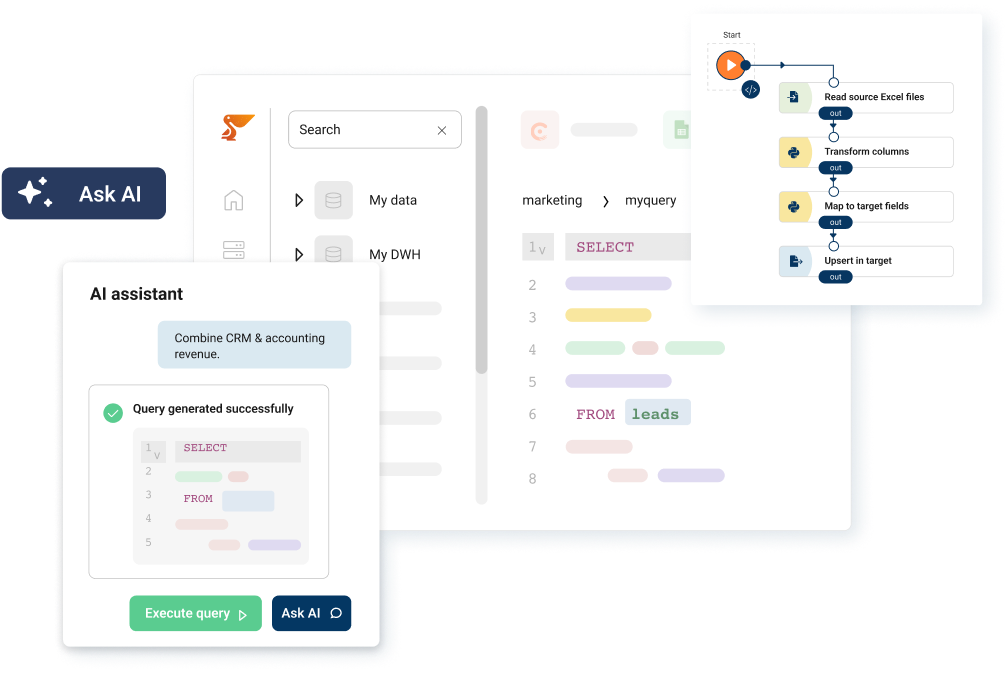
Peliqan provides managed extraction from 300+ sources with scheduling, retries and schema drift handled, then transformation in SQL or Python against the loaded data. As a result there is no API code to write or maintain per source. There is more in our guide to ETL architecture.
Use this diagram wherever you like
The diagram is free to use, including commercially, as long as there is a visible link back to this page. Download the PNG for slides and documents, or the SVG if you want to edit the labels. No email required. You can browse the rest of the set in the Peliqan diagram library.
Ready to build this on your own data? Get started with Peliqan.