
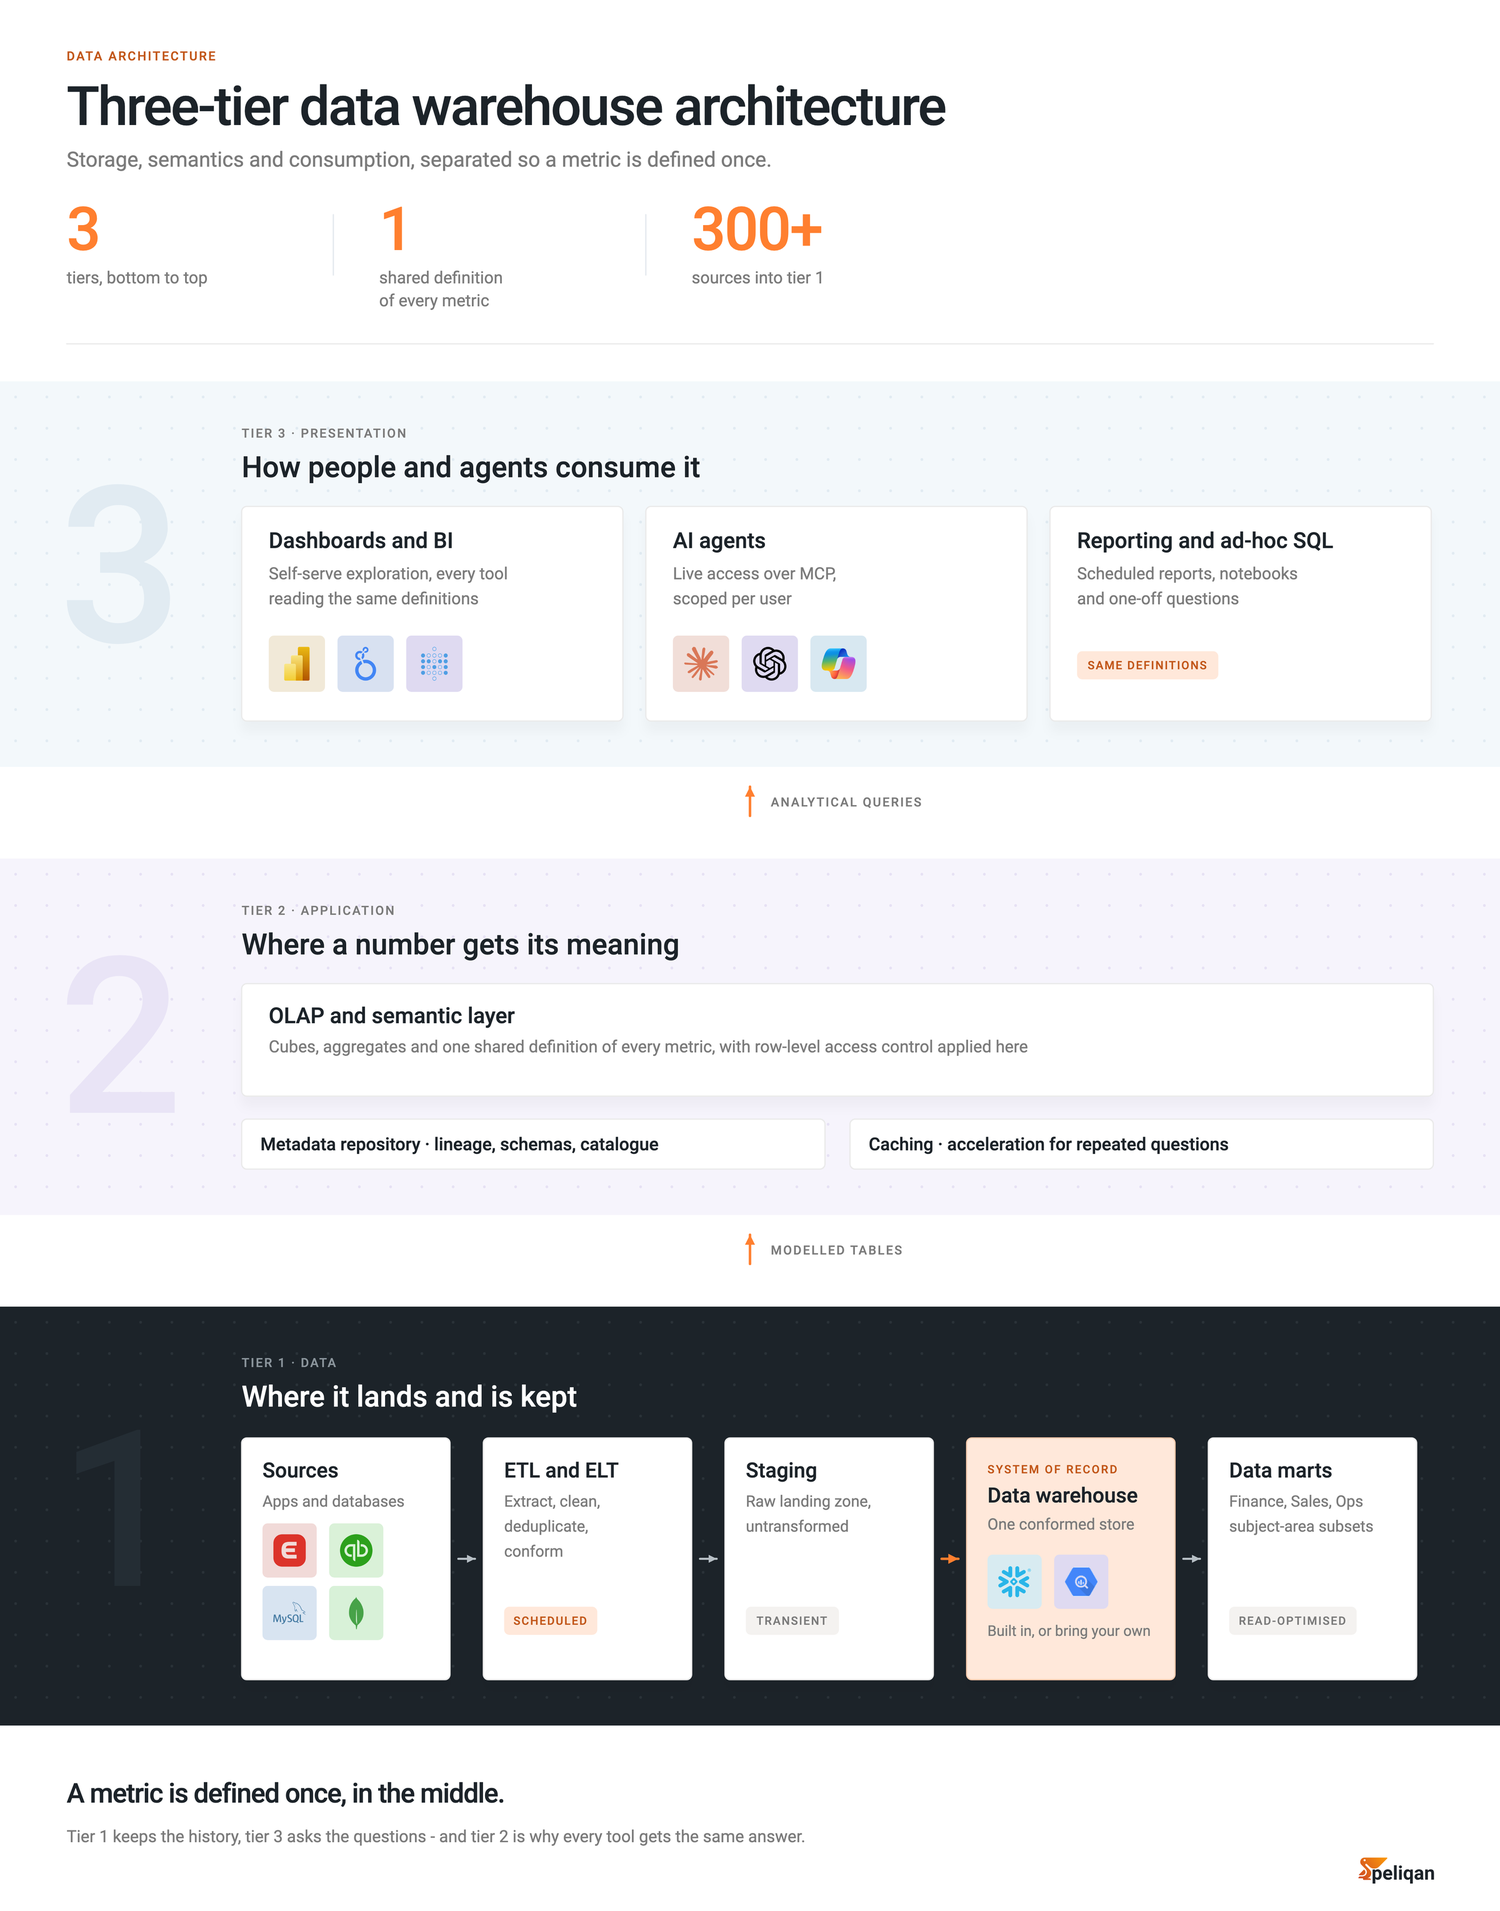

A data warehouse architecture diagram shows three things: where your data lands, where it is given shared meaning, and where people and AI agents consume it. The three-tier layout below is the one in general use, and the one most textbooks describe.
The three tiers, bottom to top
- 1Tier 1 holds the data. Source systems feed an ETL or ELT process, raw records land in a staging area, and the warehouse keeps one conformed copy with its history intact. Data marts sit alongside it as subject-area subsets for a single team. Nothing here is shaped for a particular question yet, which is what keeps it reusable.
- 2Tier 2 gives it shared meaning. An OLAP or semantic layer turns stored tables into agreed metrics. Cubes and aggregates live here, and so do row-level access rules. A metadata repository and a caching layer support this tier rather than sitting in the flow.
- 3Tier 3 is where it gets consumed. Scheduled reports, dashboards, ad-hoc SQL, and increasingly AI agents reading the same modelled tables. Because all of them read through tier 2, they inherit the same definitions and the same access rules.
Why the middle tier is the one that matters
Tier 2 is the layer teams skip, and skipping it is why two people walk into a meeting with different numbers for active customers. In short, if every BI tool defines its own metrics, the warehouse stops being a single source of truth no matter how clean the data underneath is. As a result, the middle tier earns its place the first time somebody disagrees about a number.
Single-tier and two-tier architectures
- Single-tier points reporting straight at storage. Compact, but transformation ends up hidden inside individual queries where nobody can reuse or audit it
- Two-tier adds the staging and ETL step, so arriving data is clean. It still has no semantic layer, so every tool defines its own metrics
- Three-tier adds that layer, which is why it became the default
Cloud warehouses did not remove the tiers
Separating storage from compute changed how the tiers are built, not whether they exist. Raw and modelled layers still sit inside the warehouse, the semantic layer is now often a metrics layer defined in SQL, and consumption has widened to include agents. Peliqan connects 300+ sources and can either provide the warehouse or load into the one you already run.
Where AI agents fit in tier 3
An agent connected over the Peliqan MCP server reads the same modelled tables a BI tool reads. Consequently it inherits the same metric definitions and the same access controls, rather than getting its own private copy of the data. There is more on the layers themselves in our guide to data warehouse architecture.
Use this diagram wherever you like
The diagram is free to use, including commercially, as long as there is a visible link back to this page. Download the PNG for slides and documents, or the SVG if you want to edit the labels. No email required. You can browse the rest of the set in the Peliqan diagram library.
Ready to build this on your own data? Get started with Peliqan.