


BI in data warehouse is the architectural pairing that turned raw operational records into the dashboards, KPIs, and predictive models every modern business runs on. In short, this guide explains how BI and data warehousing fit together, the four pillars of a working BI stack, the top BI tools for 2026, and how AI agents are reshaping what BI in data warehouse means right now.
For decades, business intelligence (BI) and data warehousing were treated as separate disciplines. However, that separation no longer holds. In 2026, BI is what happens to data after it has been integrated, cleansed, modeled, and stored in a warehouse – and the warehouse is what makes BI dashboards, AI agents, and reverse ETL workflows trustworthy. Furthermore, get one half wrong and the other half breaks.
Consequently, this guide walks through what BI in data warehousing actually means, why the two are inseparable, the four pillars of any modern BI stack, the top 5 BI tools, the difference between ETL and BI, and the AI-era shifts that are quietly rewriting the rulebook.
What is BI in data warehousing?
In essence, BI in data warehousing is the practice of using business intelligence tools to query, analyze, and visualize the structured data stored inside a data warehouse. Specifically, the warehouse acts as a single source of truth, consolidating data from CRMs, ERPs, billing systems, product databases, and SaaS apps. Then, BI tools sit on top of that warehouse and convert the consolidated data into dashboards, reports, and self-service analytics that business users can act on.
Notably, this combination is sometimes called BIDW (Business Intelligence and Data Warehousing). In practice, every successful BI deployment depends on a properly designed warehouse underneath, and every warehouse is only as valuable as the BI layer that exposes its insights.
How a data warehouse supports BI
A data warehouse is purpose-built for analytical workloads, not transactional ones. As a result, it differs from production databases in four ways that matter for BI:
- Historical depth: warehouses store years of historical data, enabling trend analysis and year-over-year comparisons
- Pre-modeled schemas: star and snowflake schemas keep analytical queries fast even at hundreds of millions of rows
- Cleaned and conformed data: ETL or ELT processes resolve duplicates, standardize formats, and enforce data quality before BI tools see anything
- Concurrent read performance: warehouses are optimized for many simultaneous analytical queries without locking the operational database
For a deeper primer on warehouse fundamentals before going further, the guide to understanding data warehouses walks through the architectural building blocks.
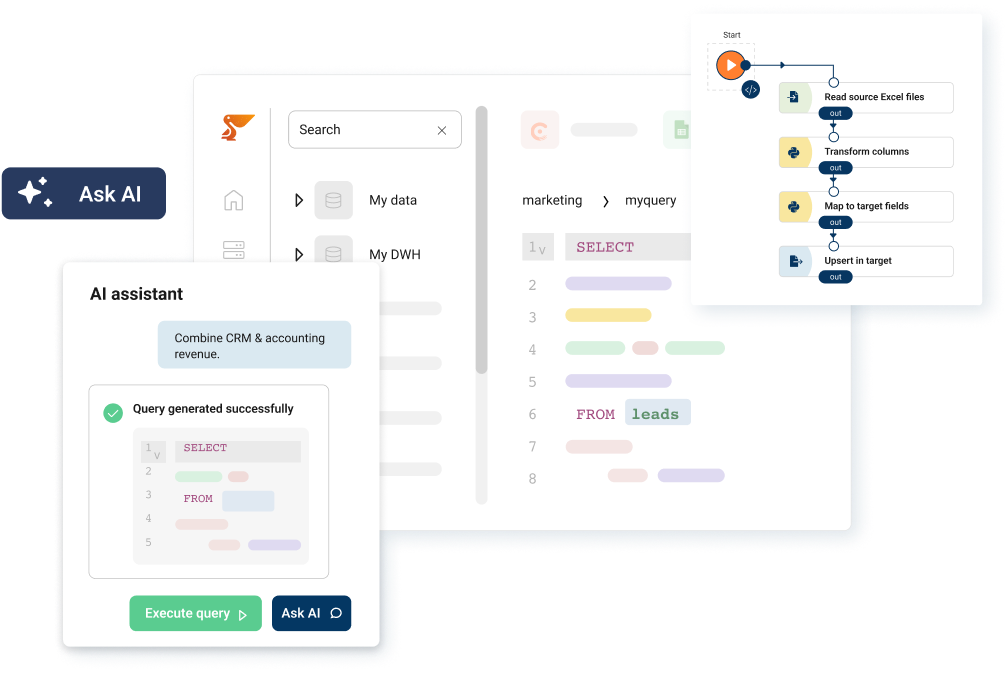
How Peliqan enhances data warehousing capabilities
Meanwhile, Peliqan simplifies the warehouse layer by offering an automated ETL pipeline, real-time data access, and out-of-the-box integration with built-in or external warehouses like Snowflake and BigQuery.
Additionally, low-code transformations, an intuitive spreadsheet UI, and automatic data lineage tracking turn a normally complex setup into something a business team can stand up in days rather than months.
The 4 pillars of BI
Modern BI rests on four pillars. Furthermore, every successful BI-in-data-warehouse deployment touches all four – skipping any one of them leaves either gaps in insight or gaps in trust.
Notably, the first pillar is where most BI projects fail. As a result, the warehouse becomes a dumping ground for inconsistent data, and the dashboards on top inherit every quality issue underneath. Therefore, prioritizing strong data integration with consistent transformation logic is what makes the other three pillars actually work.
Furthermore, the second pillar (reporting and visualization) is where BI tools meet end users. Specifically, dashboards translate the underlying warehouse tables into visuals through transformation rules that the analyst defines once and the business consumes hundreds of times. Consequently, the cleaner the warehouse, the cleaner the visualization layer.
The complete BI in data warehouse architecture
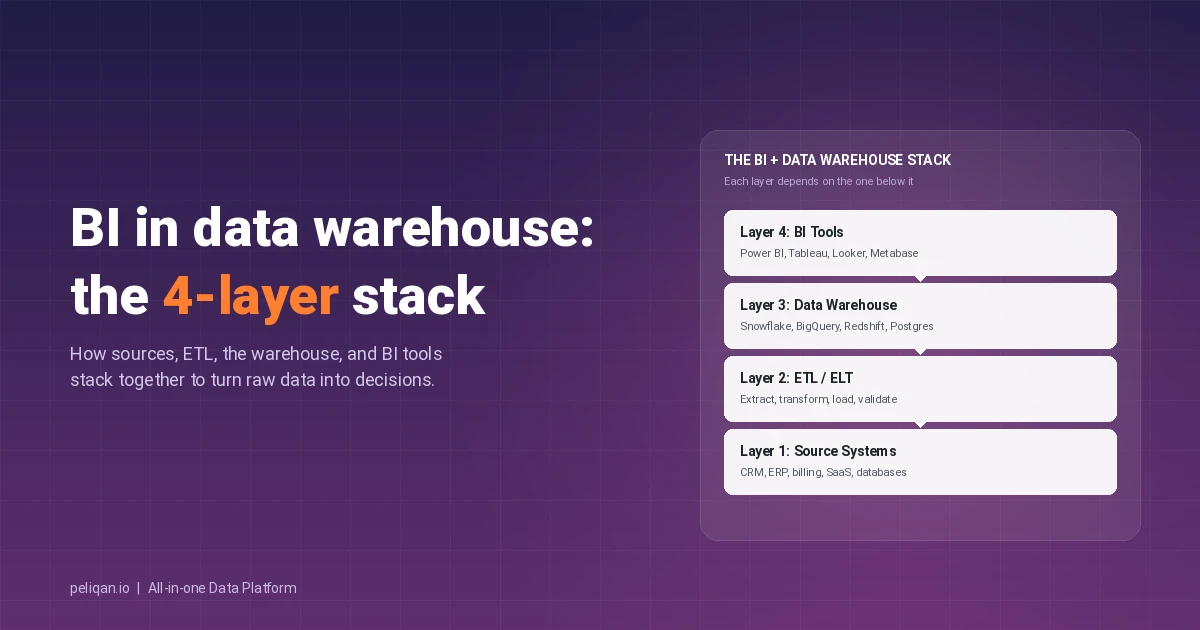
In practice, BI in data warehousing has four architectural layers. Each one has clear responsibilities, and each one needs the layer below it to function:
Layer 1: Source systems
First, this is where data is born – production databases, SaaS apps, event streams, file drops, and APIs. Typically, the data is optimized for the application that created it, not for analysis, which is exactly why a warehouse is needed downstream.
Layer 2: Integration and ETL
Next, the ETL or ELT layer extracts data from source systems, applies transformations and cleaning, and loads the modeled output into the warehouse. Importantly, in modern stacks this layer also handles incremental loads, schema drift, and data quality validation.
Layer 3: Data warehouse
Subsequently, the warehouse stores the consolidated, modeled data. Most teams now use a cloud warehouse – Snowflake, BigQuery, Redshift, or Databricks – though Postgres remains a credible choice for smaller deployments. Notably, star and snowflake schema design choices made here directly determine query performance in the BI layer above.
Layer 4: BI tools and consumption
Finally, BI tools connect to the warehouse and turn it into something a human can use – dashboards, reports, embedded analytics, alerts, and AI-powered chat interfaces. Notably, the data visualization patterns here range from simple bar charts to interactive cohort drilldowns.
For configuration specifics on connecting a BI tool to a warehouse, the docs on connecting your BI tool walk through the OAuth and ODBC paths.
Example query that crosses the stack
Consider a finance team asking: “What was Q4 gross margin by product category?”
SELECT
  dim_product.category,
  SUM(fct_order_line.revenue) AS revenue,
  SUM(fct_order_line.cogs)    AS cogs,
  (SUM(fct_order_line.revenue) - SUM(fct_order_line.cogs))
    / SUM(fct_order_line.revenue) AS gross_margin
FROM fct_order_line
JOIN dim_product
  ON fct_order_line.product_id = dim_product.id
JOIN dim_date
  ON fct_order_line.order_date = dim_date.date
WHERE dim_date.quarter = 'Q4-2025'
GROUP BY dim_product.category
ORDER BY revenue DESC;
In a Power BI or Tableau dashboard, this query becomes one slicer click. In contrast, without a warehouse underneath, the same answer requires manually joining four exports in a spreadsheet.
What is ETL and BI?
ETL and BI are different stages of the same data journey, and the distinction matters when scoping a project budget or hiring a team.
- ETL (Extract, Transform, Load) is the back-end process that pulls data from sources, reshapes it, and loads it into a warehouse. In short, ETL is plumbing – it makes the warehouse correct and complete. Specifically, ETL covers incremental loading, dimensional modeling, slowly changing dimensions, and the schema conformance work that BI tools rely on downstream.
- BI (Business Intelligence) is what business users do with the data after it lives in the warehouse – dashboards, reports, ad hoc queries, and increasingly, AI-driven question answering. Specifically, BI is the consumer of what ETL produced.
Furthermore, the relationship is sequential and bidirectional. ETL feeds the warehouse, BI reads from the warehouse, and reverse ETL (also called data activation) pushes BI-derived insights back into operational systems so that sales, marketing, and customer success teams can act on them. For the activation half of the loop, reverse ETL covers the patterns in detail.
Common confusion to clear up
- ETL is not BI: ETL has no dashboards, no end users, no business decisions – it is infrastructure
- BI is not ETL: BI tools cannot reliably do heavy transformations or large-scale integration; pushing that work into BI breaks performance and governance
- A warehouse is not BI either: it is the storage and modeling layer between them; BI needs the warehouse, the warehouse needs ETL
Why integrate BI with a data warehouse
Integrating BI directly with a data warehouse delivers four compounding benefits. Furthermore, each one cascades into the next, which is why mature data teams treat them as inseparable rather than as an option to defer.
Top 5 BI tools for 2026
Furthermore, the BI tool layer is where the warehouse becomes visible to business users. The market consolidated significantly through 2025, and in 2026 five tools dominate enterprise selection conversations.
1. Microsoft Power BI
First, Power BI remains the volume leader, ranked #1 in Gartner’s Magic Quadrant for 16 consecutive years. Specifically, the pricing starts at around $10 per user per month for Pro and scales into Microsoft Fabric for unified data and AI workloads. Notably, the deepest connector library (500+), the strongest AI Copilot integration, and tight Microsoft 365 alignment make it the default choice for organizations already standardized on Azure and Microsoft Dynamics.
2. Tableau
Next, Tableau (Salesforce) remains the visualization-first choice for data exploration. Particularly strong for analyst-driven workflows where flexibility in chart design and ad hoc exploration matters more than pre-built dashboard templates. Tableau Creator licensing runs around $75 per user per month, which places it at the higher end of the market.
3. Looker (Google Cloud)
Meanwhile, Looker is the semantic-layer leader for organizations on BigQuery. Importantly, LookML defines centralized business logic that every report consumes consistently, which is the cleanest way to avoid “metric drift” across dashboards. Furthermore, Looker pairs particularly well with code-first analytics engineering teams that already use dbt for warehouse transformations.
4. Qlik Sense
By contrast, Qlik’s associative engine lets analysts explore data relationships outside predefined queries, which surfaces correlations that SQL-modeled BI tools miss. Additionally, Qlik AutoML adds no-code predictive analytics directly inside the Qlik Sense interface. Consequently, the tool suits hypothesis-driven business analysts more than rigid governance use cases.
5. Metabase
Finally, Metabase is the open-source choice that has become genuinely enterprise-credible. Specifically, it ships in two flavors – free self-hosted and paid Cloud or Enterprise – and the question-builder interface lets non-SQL users explore data without IT bottlenecks. Notably, it is the dominant BI tool in mid-market and scale-up data stacks paired with Postgres or Snowflake.
Picking the right BI tool for your warehouse
- Azure or Microsoft estate: Power BI, with native Fabric integration
- BigQuery and Google Cloud: Looker, with LookML for governed semantics
- Snowflake or Databricks: any of the five; Tableau and Power BI most common
- Mid-market or scale-up: Metabase for cost-efficiency, Power BI for breadth
- Analyst-driven exploration: Tableau or Qlik Sense
- Self-service for non-technical users: Metabase or Power BI with Copilot
How BI and data warehouse work together: the full lifecycle
In practice, the real value comes from the lifecycle – not any individual stage. Furthermore, the four stages below run continuously, and BI tools sit on top of all of them at once:
Data collection and storage
Initially, data from CRM, ERP, billing, marketing, and product systems is ingested into the warehouse. Importantly, ETL or ELT processes enforce quality, consistency, and structure on the way in, establishing a single source of truth that downstream BI tools can rely on.
Data structuring and preparation
Next, the warehouse organizes data into schemas optimized for analysis – star, snowflake, or one big table designs – that keep BI queries fast at scale. Specifically, pre-built connectors handle the schema conformance work automatically for common SaaS sources.
Analysis and visualization through BI tools
Subsequently, BI tools connect to the warehouse and turn modeled tables into dashboards, charts, and ad hoc queries. Furthermore, business users drill from a quarterly revenue summary to a per-customer cohort view without filing a ticket with the data team.
Insight distribution and collaboration
Finally, dashboards, scheduled reports, and alerts go to the people who actually make decisions. Additionally, Peliqan’s automation layer pushes alerts and report changes via Slack and email, ensuring everyone works with the same view of the data.
Best practices for BI and data warehouse integration
Achieving a working BI and data warehouse integration requires deliberate planning rather than tool selection alone. Importantly, the practices below separate projects that ship in eight weeks from ones that linger for eighteen months.
Set clear objectives upfront
To begin, define specific business goals and KPIs before any tool selection. Then, align stakeholder expectations from the start so that scope stays focused and tied to a measurable outcome.
Prioritize data quality at ingestion
Furthermore, establish a strong validation process at the ETL layer rather than catching issues in dashboards. Specifically, automated profiling, schema drift handling, and regular audits keep BI output trustworthy.
Choose tools that scale with your team
Additionally, pick a warehouse that fits your projected 18-month volume and a BI tool that fits your team composition. Notably, code-first BI tools (Looker, dbt-aware platforms) reward engineering teams; spreadsheet-friendly BI tools (Power BI, Metabase) reward business teams.
Drive user adoption with training and visible wins
Likewise, provide training and ongoing support to keep adoption climbing. Furthermore, publicize early wins inside the organization so that BI becomes a tool people request, not one they resist.
How Peliqan simplifies BI implementation
Meanwhile, Peliqan streamlines BI implementation through a no-code and low-code environment that connects various data sources, warehouses, and BI tools in one workflow. Specifically, it automates data transformations, simplifies governance, and feeds real-time data into Power BI, Tableau, Looker, or Metabase – removing the multi-vendor friction of a traditional BI setup.
How AI and MCP are reshaping BI in data warehouse
In 2026, AI agents now read directly from warehouse tables for grounding, retrieval, and reasoning. Consequently, the BI-in-data-warehouse pattern has expanded from human-driven dashboards into agent-driven analytics. Furthermore, three shifts deserve specific attention:
- Natural language queries replace SQL for most users: Power BI Copilot, Tableau Pulse, Looker Gemini, and ThoughtSpot let business users ask “what drove last quarter’s churn” and get an answer with the source SQL visible underneath. Notably, the warehouse layer is what makes those answers correct.
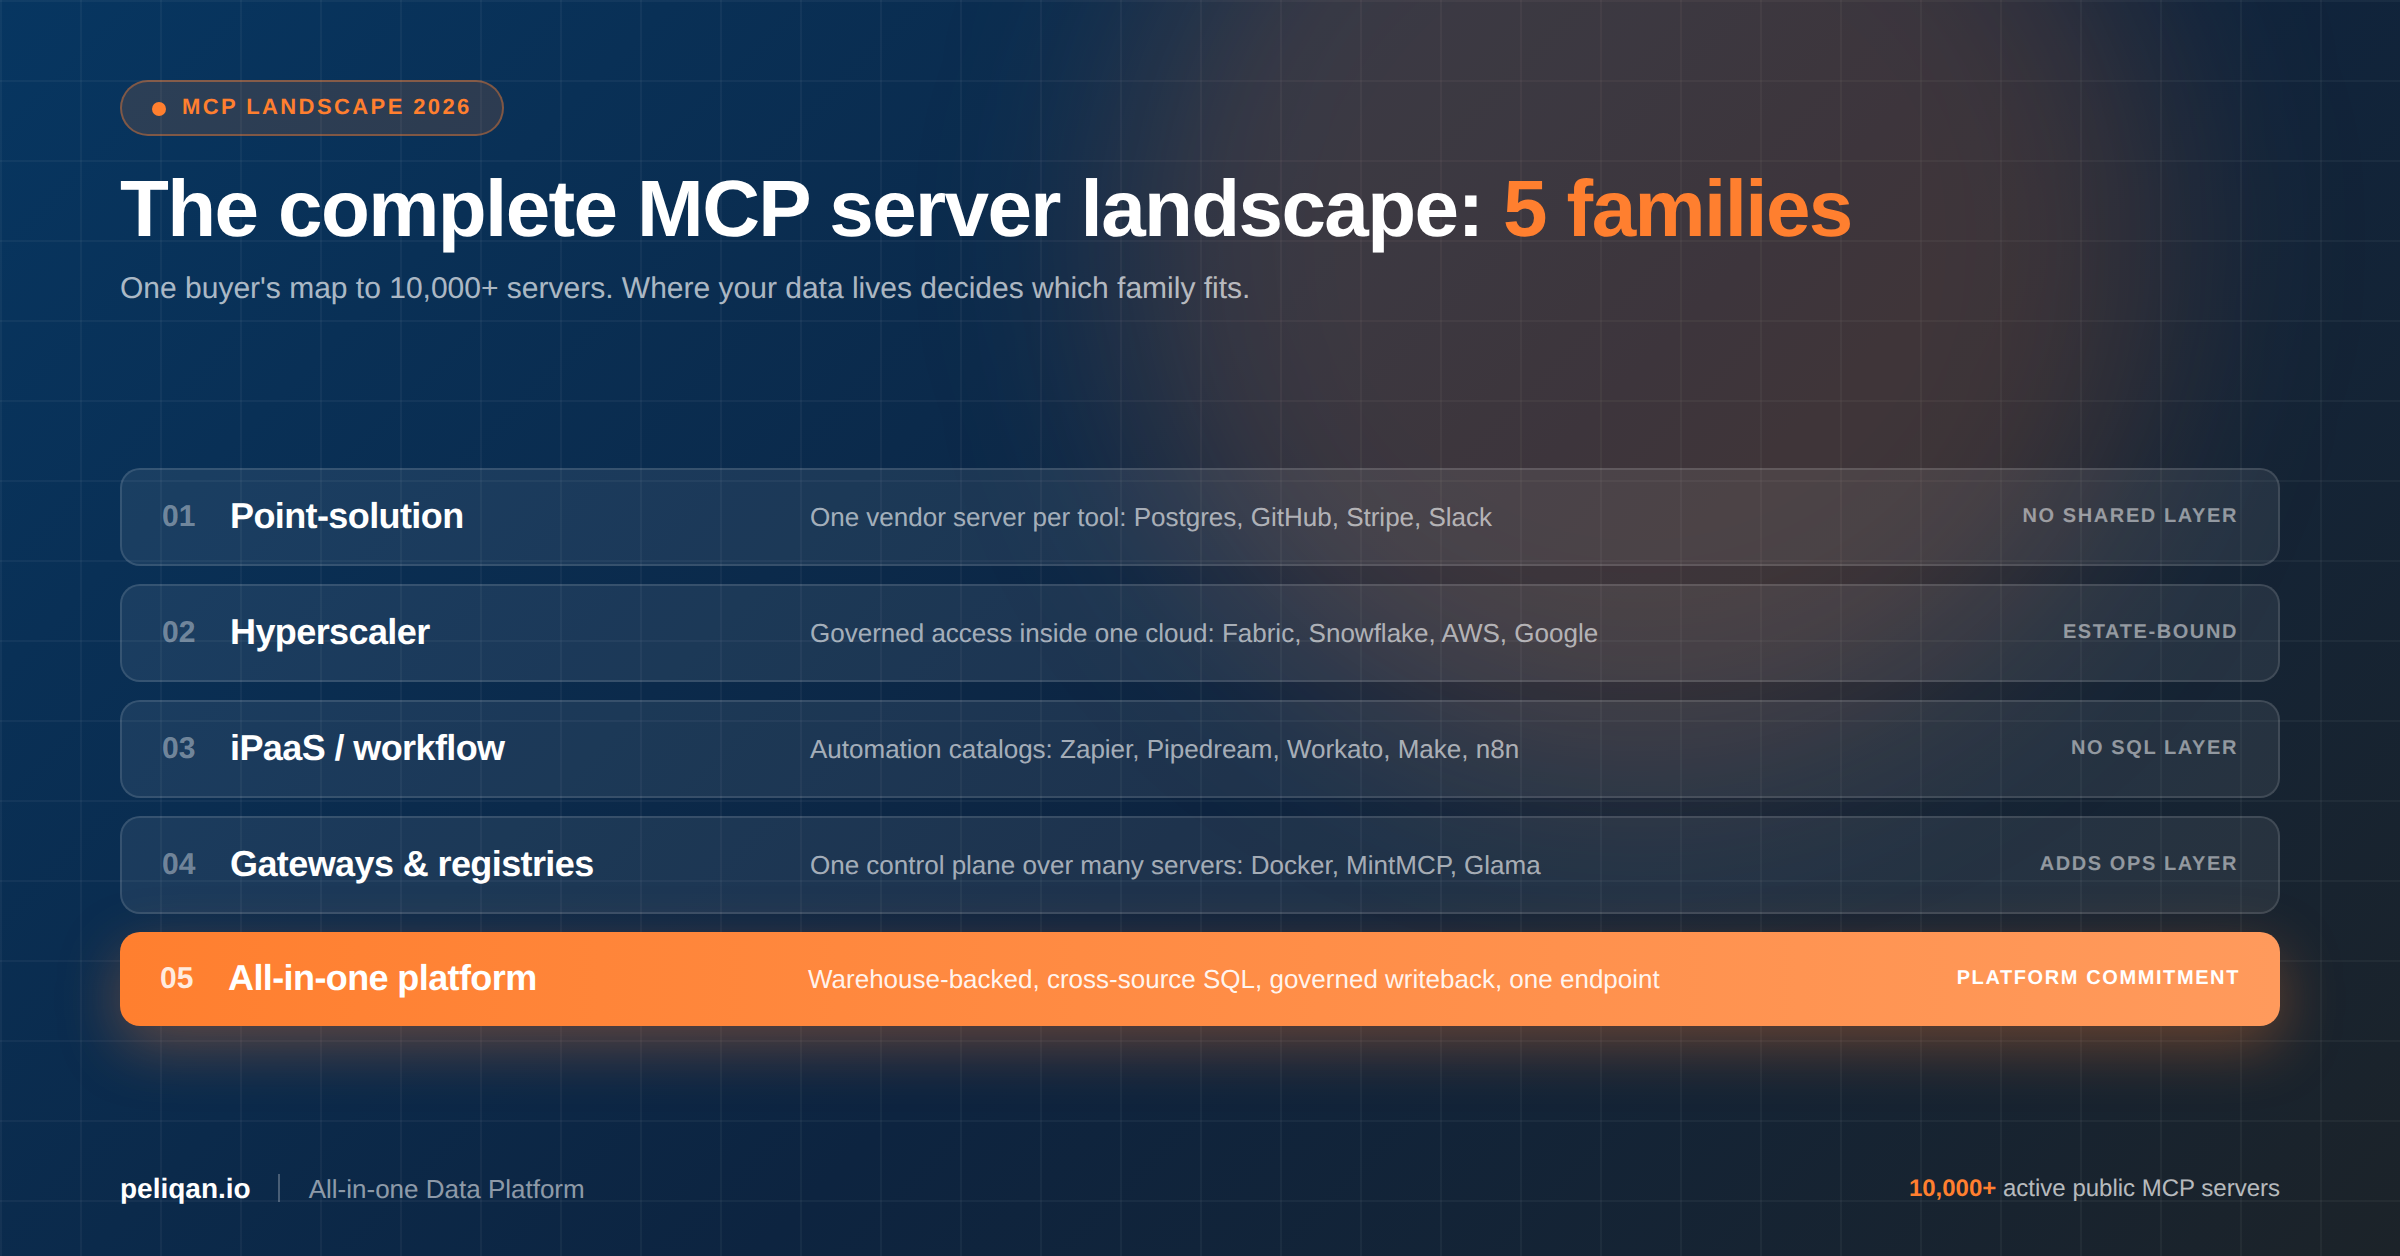
- MCP servers expose warehouse data to AI clients: Model Context Protocol turns the warehouse into a queryable surface for Claude, ChatGPT, Cursor, and any MCP-compatible client. As a result, a single MCP endpoint across all sources removes the need for one server per SaaS app.
- Reverse ETL closes the loop: insights generated in the BI layer feed back into operational systems through data activation patterns, turning dashboards from observation tools into decision-execution surfaces.
Therefore, the BI-in-data-warehouse architecture is no longer just a reporting backbone – it is the data foundation that AI agents use to answer enterprise questions. Furthermore, teams that build the warehouse layer well today are the ones whose AI agents will work tomorrow.
Cloud trends transforming BI and data warehousing
Additionally, beyond AI, three cloud-era trends continue to reshape the landscape:
Cloud-native warehouses dominate new builds
Meanwhile, Snowflake, BigQuery, Redshift, and Databricks have effectively replaced on-prem warehouses for greenfield deployments. Specifically, the pay-as-you-go model, elastic compute, and built-in security make them the default for any team starting fresh in 2026.
Furthermore, modern data warehouse implementation approaches compress what used to be 6-month projects into 4-to-8-week launches by bundling ingestion, transformation, and the warehouse itself in one workflow.
Real-time and streaming BI
Subsequently, businesses now increasingly need to act on the latest data – within minutes, not days. Therefore, change data capture (CDC) and streaming pipelines feed warehouses on a sub-minute cadence, and BI tools refresh against that warehouse state in near real-time.
Composable and all-in-one platforms
By contrast, two camps now compete: composable modern data stacks (Fivetran + Snowflake + dbt + Looker) and all-in-one platforms that collapse the stack into a single product. Notably, all-in-one platforms remove the four-vendor problem and compress launch timelines by 40-60% – particularly for mid-market teams without dedicated data engineering headcount.
Overcoming common BI and data warehouse challenges
Nevertheless, even well-planned BI and data warehouse projects face recurring integration challenges. Below, the table maps the most common ones to concrete solutions.
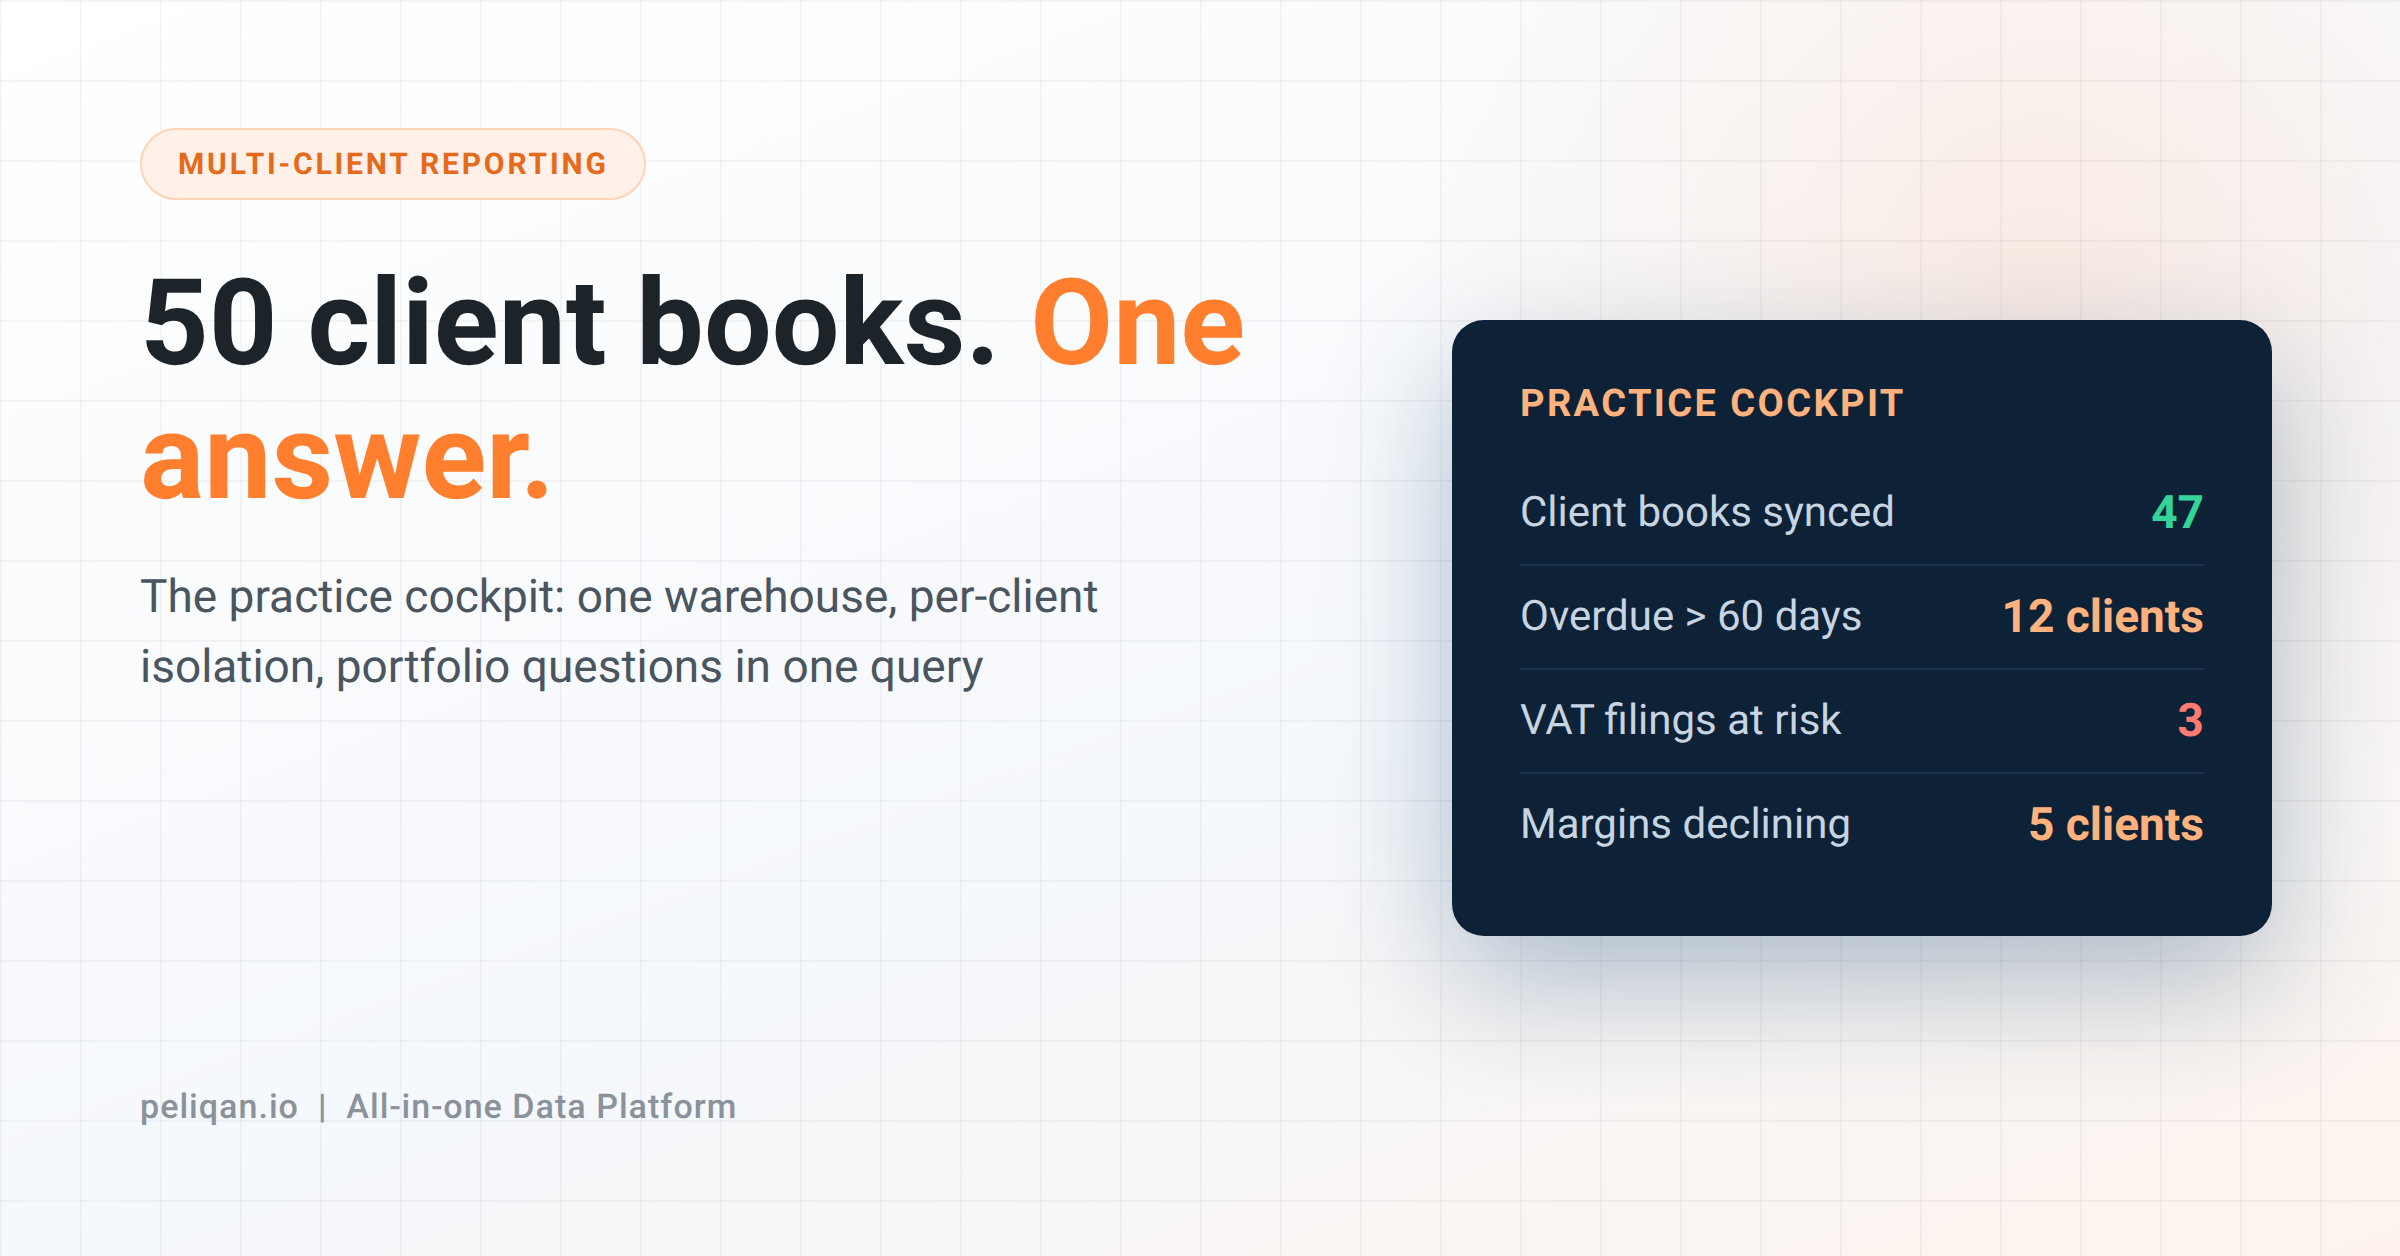
Real-world example: CIC Hospitality
CIC Hospitality manages 40+ hotels with 50+ different data sources spanning ERP, PMS, accounting, and POS systems. By consolidating everything into one warehouse and automating the board-level reporting layer through an all-in-one BI and data warehouse platform, they save more than 40 hours per month in manual data preparation – and ship monthly board reports the day the books close. Read the full case study.
Conclusion
Ultimately, integrating Business Intelligence with a data warehouse is the architectural decision that determines whether your dashboards, AI agents, and operational workflows actually share the same version of the truth. Furthermore, the right setup gives you real-time analytics, governed metrics, scalable infrastructure, and a foundation that AI workloads can build on. By contrast, the wrong one locks you into manual reconciliation, conflicting reports, and a stack that breaks the first time you try to add an AI agent.
This is where Peliqan changes the math. Specifically, Peliqan offers a comprehensive all-in-one data platform that brings BI, ETL, and data warehousing into a single environment, removing the need for separate ingestion, transformation, warehouse, and activation vendors.
Additionally, with Peliqan, you can centralize every data source, run transformations using SQL or low-code Python, and connect to your preferred BI tools for real-time insights – all on fixed pricing.
Furthermore, the platform supports advanced activation features like reverse ETL, data activation, and real-time data distribution across business applications – turning raw data into both analytical insight and operational action. As a result, by removing the friction from BI and data warehousing integrations, Peliqan lets teams focus on insights instead of infrastructure, building a cohesive end-to-end analytics experience that drives competitive advantage.