


The modern data stack promises everything and delivers complexity. In this walkthrough, we build a full ELT pipeline – HubSpot, Stripe, and PostgreSQL into a data warehouse, transformed into a customer health score, and activated back to Salesforce and Slack – using Peliqan’s built-in AI Data Engineer. No Airflow, no Terraform, no five-tool bill. Just plain English prompts and working code in under an hour.
“Vibe coding” started as a frontend story. You describe a component, an AI writes it, you tweak it, you ship it. The loop is tight, the feedback is instant, and building software feels fast again.
But try that with a data pipeline. You still need to pick between Fivetran and Airbyte, wire up dbt models, configure Airflow DAGs, provision a warehouse, write custom Reverse ETL logic, and bolt on a monitoring layer on top. Even the simplest pipeline touches five tools before it’s done. The vibe evaporates somewhere around DAG configuration.
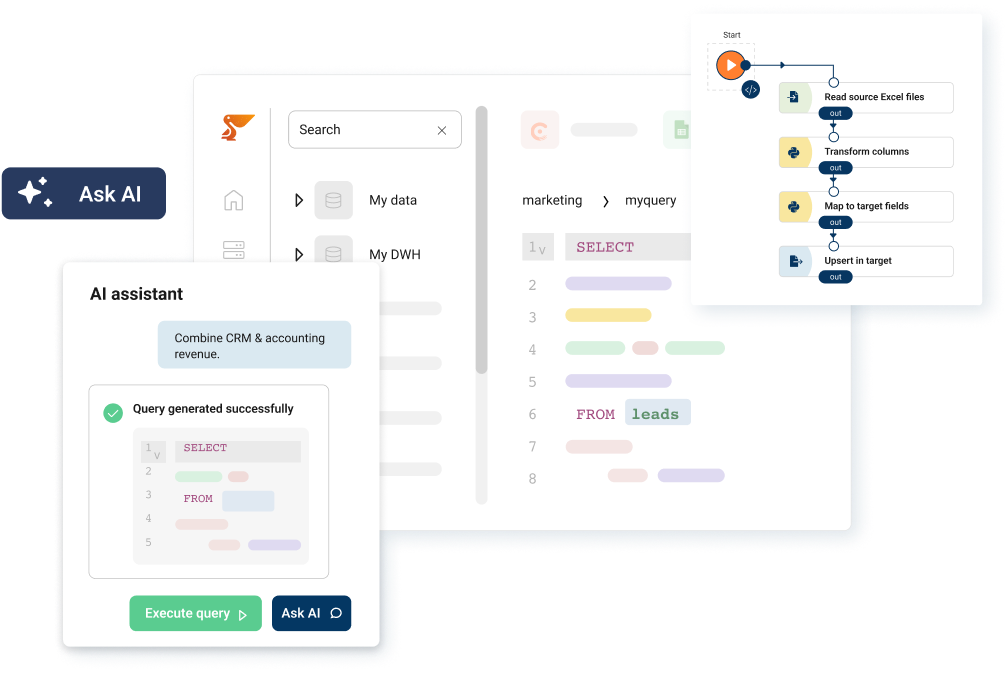
Peliqan is built to close that gap. It’s an AI-first, all-in-one data integration and activation platform that collapses the entire modern data stack into one managed environment – with a built-in AI Data Engineer that knows your table schemas, speaks Peliqan’s own API, and generates production-ready SQL and Python from plain English prompts.
In this post we’ll build a complete ELT pipeline from scratch:
- Sources: HubSpot (CRM) + Stripe (payments) + PostgreSQL (product database)
- Transform: A customer health score model, AI-generated in seconds
- Activate: Reverse ETL to Salesforce, Slack churn alerts, and a live internal dashboard
We’ll describe what we want in plain language. Peliqan’s AI Data Engineer generates the code. We review, approve, and ship – all within one afternoon.
The Modern Data Stack Tax
Before we build anything, it’s worth being honest about what the traditional stack actually costs – not just in dollars, but in time and operational complexity.
The canonical stack for this use case looks like this: Fivetran or Airbyte for ingestion, Snowflake or Redshift for storage, dbt for transformation, Airflow for orchestration, Census or Hightouch for Reverse ETL, and Retool for the internal app. Each tool is excellent in isolation. Together they require a dedicated data engineering team just to keep the lights on.
| Capability | Traditional Stack | Peliqan |
|---|---|---|
| Ingestion (ELT) | Fivetran / Airbyte – separate contract | Built-in, 250+ connectors managed |
| Data Warehouse | Snowflake / Redshift – separate contract | Built-in, or bring your own |
| Transformation | dbt – separate repo and CI/CD pipeline | SQL editor + low-code Python + AI-assisted |
| Orchestration | Airflow / Prefect – hosted or self-managed | Built-in scheduler and run logging |
| Reverse ETL | Census / Hightouch – separate contract | Low-code Python writeback connectors |
| Dashboards / Apps | Retool + separate alerting tool | Streamlit apps + built-in alerts |
| AI assistance | None – you prompt ChatGPT separately and adapt the output manually | AI Data Engineer built-in, schema-aware |
Peliqan doesn’t simplify by removing power. It runs on Singer pipelines for ELT and a Trino federated query engine for live cross-source SQL – the same open-source backbone powering enterprise data stacks at scale. The difference is that everything is pre-wired, hosted, and available from day one.
The Pipeline We’re Building
Before writing a single line of code, here is the full architecture. Three stages – Ingest, Transform, Activate – the classic ELT + Reverse ETL pattern.
HubSpot (CRM) ─────────────────────┐
Stripe (Payments) ──────────────────┼──> Peliqan Data Warehouse (PostgreSQL / BigQuery)
PostgreSQL (Product DB) ────────────┘
Raw tables ──> SQL Semantic Model ──> customer_health_score (materialised view)
Trino federated query: join live sources without copying data
customer_health_score ──> Salesforce (update Account custom fields)
customer_health_score ──> Slack (alert on score < 40 / churn risk)
customer_health_score ──> Streamlit Dashboard (live view for Customer Success team)
The entire pipeline runs on a daily schedule. Every step is observable – Peliqan surfaces run logs, row counts, and error alerts without any additional monitoring tooling.
Step 1 – Connect Your Data Sources
In Peliqan, navigate to Data Sources > Add Connection. Select HubSpot, authenticate via OAuth, and Peliqan automatically discovers your CRM schema – contacts, companies, deals, pipelines – and kicks off the initial sync. Same process for Stripe and your PostgreSQL product database. All three sources are connected and syncing in under 5 minutes.
Peliqan uses Singer-based taps under the hood: open, battle-tested ELT specs that handle schema evolution, incremental syncs, and backfills automatically. You click a button; Singer handles the rest. See the full list of available sources at peliqan.io/connectors.
💡 Federated Queries – No Data Movement Required
Peliqan’s Trino engine lets you join live data from all three sources in a single SQL query without moving it to the warehouse first. Useful for ad-hoc exploration before you decide what to materialise. Learn more in the platform overview.
Step 2 – Profile Your Raw Data
Once ingested, every table appears in Peliqan’s Data Explorer – a spreadsheet-like grid view that lets you scroll, filter, sort, and annotate data without writing SQL. For a quick health check, open the SQL editor and run:
-- Quick row count profile across all three ingested sources
SELECT 'hubspot_contacts'   AS table_name, COUNT(*) AS rows FROM hubspot.contacts
UNION ALL
SELECT 'stripe_customers',                 COUNT(*)          FROM stripe.customers
UNION ALL
SELECT 'product_usage_events',             COUNT(*)          FROM postgres.usage_events;

-- Result:
-- hubspot_contacts     -> 8,412 rows
-- stripe_customers     -> 3,201 rows
-- product_usage_events -> 2,847,990 rows
Good shape. In a traditional stack, you would now spend two or three days writing dbt models, YAML schema definitions, and source tests before touching a single transformation. Instead, we describe what we want to Peliqan’s AI Data Engineer.
Step 3 – Let the AI Data Engineer Write the Transformation
This is the vibe coding moment. In Peliqan, open a new Data App and type your prompt into the AI Data Engineer panel:
🧠 Prompt to the AI Data Engineer
“Build a customer health score model. Join HubSpot contacts with Stripe customer MRR and product usage events from the last 30 days. Score each customer 0-100 based on: 40% MRR percentile, 30% login frequency, 30% feature adoption. Materialise the result as a view called customer_health_score with a health_segment label – at_risk, needs_attention, or healthy.”
The AI Data Engineer reads your live table schemas before generating anything – so the output uses your actual field names, not generic placeholders. Here’s what it produces:
-- AI-generated transformation (reviewed and approved by human before materialising)
CREATE OR REPLACE VIEW customer_health_score AS

WITH mrr_data AS (
  SELECT
    c.email,
    SUM(s.mrr_usd)                                    AS mrr,
    NTILE(100) OVER (ORDER BY SUM(s.mrr_usd))         AS mrr_percentile
  FROM hubspot.contacts c
  JOIN stripe.customers s ON LOWER(c.email) = LOWER(s.email)
  GROUP BY c.email
),

usage_data AS (
  SELECT
    user_email                             AS email,
    COUNT(DISTINCT DATE(event_timestamp))  AS active_days,
    COUNT(DISTINCT feature_id)             AS features_used
  FROM postgres.usage_events
  WHERE event_timestamp >= NOW() - INTERVAL '30 days'
  GROUP BY user_email
),

scored AS (
  SELECT
    m.email,
    m.mrr,
    u.active_days,
    u.features_used,
    -- Weighted score: 40% MRR rank + 30% login frequency + 30% feature adoption
    ROUND(
      (0.40 * m.mrr_percentile) +
      (0.30 * LEAST(u.active_days   / 20.0 * 100, 100)) +
      (0.30 * LEAST(u.features_used / 10.0 * 100, 100))
    , 1) AS health_score
  FROM mrr_data m
  LEFT JOIN usage_data u USING (email)
)

SELECT
  s.email,
  s.mrr,
  s.active_days,
  s.features_used,
  s.health_score,
  CASE
    WHEN s.health_score < 40 THEN 'at_risk'
    WHEN s.health_score < 70 THEN 'needs_attention'
    ELSE                          'healthy'
  END AS health_segment,
  NOW() AS scored_at
FROM scored s;
The AI generated this in about 8 seconds. It correctly identified the email-based join between HubSpot and Stripe, applied NTILE(100) percentile ranking for MRR normalisation, and used LEAST() caps to prevent usage scores from exceeding 100. A human reviewer might tweak the weighting or add edge-case handling for paused Stripe subscriptions – and that is exactly the right level of engagement. The structural heavy lifting is done.
⚠️ Always Review Before Materialising
The AI doesn’t know your business edge cases – a customer with two email addresses, a Stripe subscription paused mid-month, a product event logged against a service account. Run the output on a known-good sample and validate row counts before scheduling a production run. The pattern we recommend: AI generates – human reviews – human approves – Peliqan runs.
How does the AI know your schemas?
Peliqan’s AI Data Engineer is context-aware at three levels. First, it reads your live table structures, column names, and cardinalities from the warehouse in real time before writing a single line of code. Second, it is trained on Peliqan’s own low-code Python function library, so it generates idiomatic pq. API calls rather than generic Python you have to adapt. Third, when a scheduled run fails, it can read the error log and suggest a fix – inside the same interface. You never leave the platform to debug. Read more in the Data Apps documentation.
Step 4 – Reverse ETL and Slack Alerting in Low-Code Python
The transformation is live. Now we activate it. We need two things: write the health_score and health_segment fields back to Salesforce Accounts, and fire a Slack alert whenever a customer’s score drops below 40.
In Peliqan this is a Data App – a low-code Python script that runs in Peliqan’s managed runtime. The pq module is auto-available in every Data App and exposes all the connectors you configured in Step 1 – no SDK to install, no credentials to manage, no token refresh logic to write.
# Peliqan Data App: sync health scores to Salesforce + alert on churn risk
# pq module is auto-available - no imports or credentials needed

# -- 1. Read today's health scores from the warehouse ------------------
df = pq.read_sql("""
    SELECT email, health_score, health_segment, mrr
    FROM customer_health_score
    WHERE scored_at::date = CURRENT_DATE
""")

# -- 2. Connect to Salesforce via the pre-configured OAuth connector ---
sf = pq.connect('Salesforce')

# -- 3. Reverse ETL: upsert Account custom fields ---------------------
for _, row in df.iterrows():
    sf.update(
        'Account',
        lookup_field      = 'Email__c',
        lookup_value      = row['email'],
        Health_Score__c   = row['health_score'],
        Health_Segment__c = row['health_segment']
    )

pq.log(f"Synced {len(df)} accounts to Salesforce")

# -- 4. Slack alert for at-risk accounts ------------------------------
at_risk = df[df['health_segment'] == 'at_risk']

if not at_risk.empty:
    slack = pq.connect('Slack')
    message = f":rotating_light: *{len(at_risk)} customers at churn risk today*\n"

    for _, row in at_risk.head(5).iterrows():
        message += (
            f"- {row['email']} "
            f"score: {row['health_score']:.0f}  "
            f"MRR: ${row['mrr']:,.0f}\n"
        )

    slack.send(channel='#customer-success', text=message)
That is the complete Reverse ETL and alerting layer in 30 lines of Python. pq.connect('Salesforce') resolves to the authenticated connection from Step 1 – Peliqan handles token refresh, rate limiting, and retry logic. You can test this script line-by-line in Peliqan’s built-in IDE with your live warehouse wired up. No local virtualenv, no .env file, no pip install dance.
Step 5 – Schedule, Monitor, and Build the Internal Dashboard
The pipeline works. Now we make it production-grade with two more steps.
Scheduling: In the Data App settings, set a cron expression – 0 6 * * * to run at 6am UTC every day. Peliqan manages execution, logs every run with row counts and duration, and sends an email notification if the script fails. No Airflow configuration required.
Internal dashboard: Peliqan has Streamlit built in. Add a separate Data App to give your Customer Success team a live view of health scores – no Retool licence, no separate deployment:
import streamlit as st

st.title("Customer Health Dashboard")

# Pull live data from the warehouse - always up to date
df = pq.read_sql("""
    SELECT email, health_score, health_segment, mrr, scored_at
    FROM customer_health_score
    ORDER BY health_score ASC
    LIMIT 500
""")

# KPI summary row
col1, col2, col3 = st.columns(3)
col1.metric("At Risk",         len(df[df.health_segment == 'at_risk']))
col2.metric("Needs Attention", len(df[df.health_segment == 'needs_attention']))
col3.metric("Healthy",         len(df[df.health_segment == 'healthy']))

# Colour-coded sortable table
st.dataframe(
    df[['email', 'mrr', 'health_score', 'health_segment']],
    use_container_width=True
)
Peliqan publishes the Streamlit app on a secure, shareable URL. Your Customer Success team opens it in a browser – no credentials, no setup, live data updated every morning.
What We Built – and What We Skipped
📊 Pipeline Summary
Under 1 hour from zero to production pipeline - no infrastructure setup requiredWhat we did not touch: no Terraform, no Airflow DAG, no dbt project repo, no Singer tap configuration files, no separate Reverse ETL vendor, no Retool licence, no standalone alerting system. The entire pipeline lives in one platform, one login, one bill.
Where to Take This Next
The pipeline we built is a foundation, not a ceiling. Peliqan’s architecture is composable – each layer can be extended without breaking what’s already working.
Add more sources: Peliqan supports 250+ connectors – Zendesk for support ticket volume, Mixpanel for funnel events, Google Sheets for manually curated account tiers. Each adds a new dimension to your health score without a new pipeline or a new vendor.
Publish a Data API: Peliqan’s API Builder lets you wrap any SQL query as a typed REST endpoint in a few clicks. Your product team can call GET /api/v1/customer-health?email=john@acme.io and get a live health score without warehouse access – useful for in-product nudges, onboarding flows, or partner integrations.
Connect it to an AI agent via MCP: With Peliqan’s MCP server support, you can expose this data to Claude, GPT-4, or any MCP-compatible AI agent. Your CS team can ask “Which at-risk accounts renew in the next 30 days?” and get a live answer from your warehouse – no SQL required. Here is what a Peliqan MCP tool definition looks like:
# Expose the health score endpoint to any MCP-compatible AI agent
@pq.mcp_tool(
    name="get_customer_health",
    description="Returns the current health score for a customer by email address"
)
def get_customer_health(email: str):
    result = pq.read_sql(f"""
        SELECT health_score, health_segment, mrr, scored_at
        FROM customer_health_score
        WHERE email = '{email}'
        ORDER BY scored_at DESC LIMIT 1
    """)
    return result.to_dict(orient='records')[0]
For a full walkthrough of building AI agents on top of Peliqan, see the Peliqan for AI page.
🎯 Which Peliqan feature fits your next step?
- Need to sync data back to a CRM, ERP, or SaaS app? – Reverse ETL with low-code Python
- Need business users to explore data without SQL? – Data Explorer spreadsheet UI
- Need to expose data to an AI agent or chatbot? – Peliqan MCP Server
- Need a customer-facing or embedded analytics app? – Streamlit Data Apps with white-label support
- Need to connect a source not yet in the library? – Custom connector builder
Conclusion
The promise of vibe coding is that describing what you want should be enough. In data integration, that promise has mostly been theoretical – you still needed to know which tool to pick, how to configure it, and how to wire five tools together before writing a single transformation.
Peliqan closes that gap – not by stripping out the power, but by making the full stack available through one interface with an AI that already knows your data. Singer, Trino, and production-grade scheduling are all there. You just don’t have to assemble them.
The pipeline we built today – three sources, an AI-generated health score model, Salesforce Reverse ETL, Slack churn alerts, and a live Streamlit dashboard – would have taken a data engineering team a week with the traditional stack. With Peliqan’s AI Data Engineer and low-code Python Data Apps, it took an afternoon.
That is what self-service data activation looks like in practice: the AI handles the scaffolding, the human provides the business judgment, and the team gets insights the same day.
Ready to build your first pipeline? Try Peliqan free – connect your first data source in minutes with no credit card required. Or explore the full documentation to see what’s possible before you sign up.