


Power BI Connector
Table of Contents
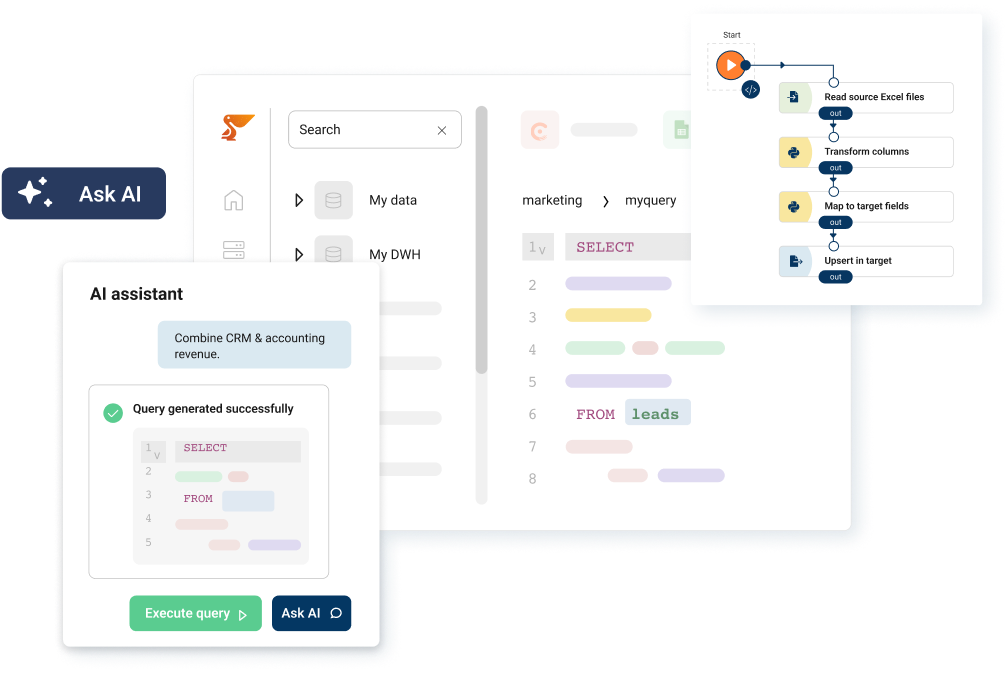
Power BI Connector: Data to Power BI
In today’s data-driven business landscape, the ability to access and analyze data from various sources is crucial for making informed decisions. Peliqan is a powerful platform that simplifies this process by providing direct data access to a wide range of data sources, including SaaS business applications, databases, data warehouses, APIs, and files. This comprehensive guide will walk you through the process of connecting to data sources using Peliqan, enabling you to harness the full potential of your data.
Peliqan’s flexible architecture allows you to connect to both cloud-based and on-premises data sources, making it an ideal solution for businesses with diverse data ecosystems. Whether you’re working with traditional relational databases, modern NoSQL databases, or popular SaaS applications, Peliqan has you covered.
Getting Started: Adding a New Connection
The first step in leveraging Peliqan’s data integration capabilities is to add a new connection. Here’s how to do it:
- Log in to your Peliqan account.
- Navigate to the “Connections” section.
- Click on “Add new connection”.
- Select the connection type from the available options.
- Enter the required credentials or complete the OAuth flow, depending on the chosen connection type.
Once you’ve added a connection, Peliqan automatically sets up a data pipeline and begins the synchronization process for SaaS sources or schema discovery for databases. This process typically takes between a few seconds to a few minutes, depending on the size and complexity of your data source.
Understanding Connection Types and Behaviors
Peliqan handles different types of data sources in unique ways to optimize performance and data accessibility:
Databases, Data Warehouses, and Data Lakes
For these types of connections, Peliqan performs schema discovery without replicating the actual data. This means it creates a catalog of all databases, schemas, tables, and columns within the source. When you access data from these sources or execute SQL queries in Peliqan, it uses a direct database connection to fetch the data in real-time.
Key points:
- Data is not replicated unless you explicitly materialize a table in Peliqan.
- Peliqan’s built-in distributed query engine (Trino) allows you to combine data across multiple sources.
SaaS Applications
When connecting to SaaS applications, Peliqan sets up an ETL (Extract, Transform, Load) pipeline to replicate your data into either the built-in Peliqan data warehouse or a data warehouse of your choice (such as Snowflake or BigQuery).
Key points:
- Peliqan creates one table per object type (e.g., Contacts, Companies, Deals for a CRM like HubSpot).
- Data synchronization is incremental where possible, with customizable sync intervals.
By providing these powerful connections to databases, data warehouses, and SaaS applications, Peliqan enables you to make the most of your existing data infrastructure while adding powerful data integration, transformation, and analysis capabilities.
Integrate Any Platform with Power BI
Now, let’s explore how this process works for various popular data sources, along with examples of how you can leverage this integration for powerful insights. Let’s take some popular tools + Power BI integrations in each categories,
Finance & Accounting
Xero Power BI
NetSuite Power BI
QuickBooks Power BI
Exact Online Power BI
E-Commerce & Helpdesk
Shopify Power BI
Jira Power BI
Zendesk Power BI
ERP
Odoo Power BI
AFAS Power BI
Databases & Data Warehouses
Snowflake Power BI
MongoDB Power BI
Redshift Power BI
Marketing & Sales
HubSpot Power BI
LinkedIn Power BI
Facebook Power BI
Productivity
Google Sheets Power BI
Airtable Power BI
Notion Power BI
OneDrive Power BI
Workday Power BI
Xero Power BI
Xero, a popular cloud-based accounting software, holds valuable financial data that can significantly enhance your Power BI reports. Here’s how to connect Xero to Power BI using Peliqan:
- Use the Xero connector in Peliqan
- Authenticate your Xero account
- Select the desired tables (e.g., Invoices, Payments, Accounts)
- Transform and load the data into Peliqan
- Connect Peliqan DW to Power BI using PowerBI connector
- Send the desired Xero data to Power BI
- Create dashboards in Power BI
Try for free >> Xero Connector
Example: Cash Flow Analysis Dashboard
Assumptions:
- Tables Used: Xero.Invoices and Xero.Payments.
- Join Key: InvoiceID links invoices to payments.
- Date Range: Data is queried for all available dates.
- Invoice and Payment Structure: Each invoice might have multiple payments, and some invoices may not have payments recorded.
- Null Handling: COALESCE function is used to handle cases where a payment might be null.
Create a dynamic cash flow analysis dashboard to visualize cash inflows and outflows.
SELECT
i.Date AS TransactionDate,
i.InvoiceNumber,
i.Total AS InvoiceAmount,
p.Amount AS PaymentAmount,
i.Total - COALESCE(p.Amount, 0) AS OutstandingAmount
FROM
Xero.Invoices i
LEFT JOIN
Xero.Payments p ON i.InvoiceID = p.InvoiceID
ORDER BY
i.Date
This SQL query combines invoice and payment data, allowing you to visualize cash inflows and outflows over time in Power BI.
NetSuite Power BI
NetSuite, an all-in-one cloud business management suite, offers a comprehensive set of business data. Here’s how to connect NetSuite to Power BI with Peliqan:
- Use the NetSuite connector in Peliqan
- Authenticate your NetSuite account
- Select the desired NetSuite records and fields
- Transform and load the data into Peliqan
- Connect Peliqan DW to Power BI using PowerBI connector
- Send the desired NetSuite data to Power BI
- Create dashboards in Power BI
Try for free >> NetSuite Connector
Example: Financial Performance and Inventory Management Dashboard
Assumptions:
- Tables Used: NetSuite.Transactions and NetSuite.Items.
- Join Key: ItemID links transactions to inventory items.
- Date Range: Data is queried for transactions in the last 180 days.
- Transaction Types: Various transaction types are present in the Transactions table.
- Inventory Levels: Items have current quantities and reorder points.
Develop a dashboard that combines financial and inventory data from NetSuite. Here’s a sample query in Peliqan:
SELECT
t.TransactionDate,
t.TransactionType,
t.Amount,
i.ItemName,
i.QuantityAvailable,
i.ReorderPoint
FROM
NetSuite.Transactions t
JOIN
NetSuite.Items i ON t.ItemID = i.ItemID
WHERE
t.TransactionDate >= DATE_SUB(CURRENT_DATE, INTERVAL 180 DAY)
This SQL query allows you to create visualizations in Power BI that show financial trends alongside inventory levels and reorder points.
QuickBooks Power BI
QuickBooks, a widely used accounting software, contains crucial financial data for businesses. Here’s how to connect QuickBooks to Power BI using Peliqan:
- Use the QuickBooks connector in Peliqan
- Authenticate your QuickBooks account
- Select the relevant financial data and reports
- Transform and load the data into Peliqan
- Connect Peliqan DW to Power BI using PowerBI connector
- Send the desired QuickBooks data to Power BI
- Create dashboards in Power BI
Try for free >> QuickBooks Connector
Example: Profit and Loss Analysis Dashboard
Assumptions:
- Tables Used: QuickBooks.Revenue, QuickBooks.Expenses, QuickBooks.Categories.
- Join Keys: CustomerRef links Transactions to Customers; ProductRef links Transactions to Products.
- Date Range: Data is queried for the past year.
- Profitability Analysis: Aggregates data to show overall profitability.
- Currency: All financial figures are in a standard currency or converted for analysis.
Create a detailed profit and loss analysis dashboard. Here’s a sample query in Peliqan:
SELECT
t.TxnDate,
t.AccountType,
t.AccountName,
t.Amount,
c.CustomerName,
p.ProductName
FROM
QuickBooks.Transactions t
LEFT JOIN
QuickBooks.Customers c ON t.CustomerRef = c.CustomerID
LEFT JOIN
QuickBooks.Products p ON t.ProductRef = p.ProductID
WHERE
t.TxnDate >= DATE_SUB(CURRENT_DATE, INTERVAL 365 DAY)
ORDER BY
t.TxnDate
This SQL query allows you to create Power BI visualizations that show revenue streams, expense categories, and profitability over time.
Exact Online Power BI
Exact Online, a cloud-based business software, offers comprehensive financial and business management data. Here’s how to connect Exact Online to Power BI using Peliqan:
- Use the Exact Online connector in Peliqan
- Authenticate your Exact Online account
- Choose the relevant data tables and fields
- Transform and load the data into Peliqan
- Connect Peliqan DW to Power BI using PowerBI connector
- Send the desired Exact Online data to Power BI
- Create dashboards in Power BI
Try for free >> Exact Online Connector
Example: Financial Health Dashboard
Assumptions:
- Tables Used: ExactOnline.Transactions, ExactOnline.Accounts, ExactOnline.Customers, ExactOnline.Invoices.
- Join Keys: AccountCode links transactions to accounts; RelationCode links transactions to customers; TransactionID links to invoices.
- Date Range: Data is queried for transactions in the last 180 days.
- Transaction Details: Includes transaction dates, amounts, and related customer and invoice information.
Develop a dashboard that provides insights into your company’s financial health. Here’s a sample query in Peliqan:
SELECT
t.TransactionDate,
t.AccountCode,
a.AccountName,
t.Amount,
t.Description,
c.CustomerName,
i.InvoiceNumber
FROM
ExactOnline.Transactions t
JOIN
ExactOnline.Accounts a ON t.AccountCode = a.AccountCode
LEFT JOIN
ExactOnline.Customers c ON t.RelationCode = c.CustomerCode
LEFT JOIN
ExactOnline.Invoices i ON t.TransactionID = i.TransactionID
WHERE
t.TransactionDate >= DATE_SUB(CURRENT_DATE, INTERVAL 180 DAY)
This SQL query allows you to create Power BI visualizations that show cash flow, accounts receivable aging, and revenue trends.
Shopify Power BI
Shopify, a leading e-commerce platform, contains valuable data about your online store’s performance. Here’s how to connect Shopify to Power BI with Peliqan:
- Use the Shopify connector in Peliqan
- Authenticate your Shopify account
- Select the relevant data (e.g., orders, products, customers)
- Transform and load the data into Peliqan
- Connect Peliqan DW to Power BI using PowerBI connector
- Send the desired Shopify data to Power BI
- Create dashboards in Power BI
Try for free >> Shopify Connector
Example: E-commerce Performance Dashboard
Assumptions:
- Tables Used: Shopify.Orders, Shopify.Products, Shopify.Inventory, Shopify.Customers.
- Join Keys: ProductID links orders to products and inventory; CustomerID links orders to customers.
- Date Range: Data is queried for orders in the last 90 days.
- Product Information: Includes product names and inventory details.
- Customer Information: Includes customer cities and countries.
Build a comprehensive e-commerce dashboard that tracks sales, product performance, and customer behavior. Here’s a sample query in Peliqan:
SELECT
p.ProductName,
SUM(o.Quantity) as TotalSold,
AVG(o.Price) as AveragePrice,
i.QuantityOnHand,
c.CustomerCity,
c.CustomerCountry
FROM
Shopify.Orders o
JOIN
Shopify.Products p ON o.ProductID = p.ProductID
JOIN
Shopify.Inventory i ON p.ProductID = i.ProductID
JOIN
Shopify.Customers c ON o.CustomerID = c.CustomerID
WHERE
o.OrderDate >= DATE_SUB(CURRENT_DATE, INTERVAL 90 DAY)
GROUP BY
p.ProductName, i.QuantityOnHand, c.CustomerCity, c.CustomerCountry
This SQL query allows you to create Power BI visualizations that show top-selling products, inventory levels, and geographical sales distribution.
JIRA Power BI
JIRA, Atlassian’s popular project management and issue tracking tool, contains valuable data about your team’s work and productivity. Here’s how to connect JIRA to Power BI using Peliqan:
- Use the JIRA connector in Peliqan
- Authenticate your JIRA account
- Select the relevant JIRA projects and issue types
- Transform and load the data into Peliqan
- Connect Peliqan DW to Power BI using PowerBI connector
- Send the desired JIRA data to Power BI
- Create dashboards in Power BI
Try for free >> JIRA Connector
Example: Agile Project Management Dashboard
Assumptions:
- Tables Used: JIRA.Issues, JIRA.Sprints, JIRA.Users
- Join Keys: SprintID links Issues to Sprints; AssigneeID links Issues to Users
- Date Range: Data is queried for issues updated in the last 90 days
- Metrics: Includes issue status, story points, sprint progress, and assignee information
Develop a dashboard that tracks your team’s agile development process. Here’s a sample query in Peliqan:
SELECT
 i.IssueKey,
 i.Summary,
 i.IssueType,
 i.Status,
 i.StoryPoints,
 s.SprintName,
 s.StartDate,
 s.EndDate,
 u.DisplayName as Assignee
FROM
 JIRA.Issues i
LEFT JOIN
 JIRA.Sprints s ON i.SprintID = s.SprintID
LEFT JOIN
 JIRA.Users u ON i.AssigneeID = u.UserID
WHERE
 i.UpdatedDate >= DATEADD(day, -90, CURRENT_DATE())
ORDER BY
 s.StartDate, i.StoryPoints DESC
This SQL query allows you to create Power BI visualizations that show sprint progress, issue distribution, and team member workload. You can track key agile metrics such as velocity, burndown, and cycle time.
Zendesk Power BI
Zendesk, a customer service and engagement platform, contains valuable data about customer interactions. Here’s how to connect Zendesk to Power BI using Peliqan:
- Use the Zendesk connector in Peliqan
- Authenticate your Zendesk account
- Select the relevant data (e.g., tickets, users, satisfaction ratings)
- Transform and load the data into Peliqan
- Connect Peliqan DW to Power BI using PowerBI connector
- Send the desired Zendesk data to Power BI
- Create dashboards in Power BI
Try for free >> Zendesk Connector
Example: Customer Support Performance Dashboard
Assumptions:
- Tables Used: Zendesk.Tickets, Zendesk.Agents, Zendesk.Satisfaction.
- Join Keys: AssignedAgentID links tickets to agents; TicketID links satisfaction scores.
- Date Range: Data is queried for tickets created in the last 30 days.
- Ticket Details: Includes ticket resolution times and satisfaction scores.
Create a dashboard that tracks key customer support metrics. Here’s a sample query in Peliqan:
SELECT
t.TicketID,
t.Subject,
t.Status,
t.Priority,
t.CreatedAt,
t.ResolvedAt,
DATEDIFF(HOUR, t.CreatedAt, t.ResolvedAt) as ResolutionTime,
a.Name as AssignedAgent,
s.Score as SatisfactionScore
FROM
Zendesk.Tickets t
LEFT JOIN
Zendesk.Agents a ON t.AssignedAgentID = a.AgentID
LEFT JOIN
Zendesk.Satisfaction s ON t.TicketID = s.TicketID
WHERE
t.CreatedAt >= DATE_SUB(CURRENT_DATE, INTERVAL 30 DAY)
This SQL query allows you to visualize ticket resolution times, customer satisfaction scores, and agent performance in Power BI.
HubSpot Power BI
HubSpot, a leading CRM and marketing automation platform, contains a wealth of customer and marketing data. Here’s how to integrate HubSpot with Power BI using Peliqan:
- Use the HubSpot connector in Peliqan
- Authenticate your HubSpot account
- Select the desired data (e.g., Contacts, Deals, Marketing Emails)
- Transform and load the data into Peliqan
- Connect Peliqan DW to Power BI using PowerBI connector
- Send the desired HubSpot data to Power BI
- Create dashboards in Power BI
Try for free >> Hubspot Connector
Example: Sales Pipeline and Lead Conversion Dashboard
Assumptions:
- Tables Used: HubSpot.Contacts and HubSpot.Deals.
- Join Key: ContactID links contacts to deals.
- Date Range: Data is queried for deals closed in the last 90 days.
- Lifecycle Stages and Deal Stages: Contacts and deals have fields for lifecycle stages and deal stages respectively.
- Deal Closure: Deals have an associated close date.
Create a comprehensive sales and marketing dashboard by combining HubSpot contact and deal data. Here’s a sample query in Peliqan:
SELECT
c.Email,
c.Lifecycle_Stage,
d.DealStage,
d.Amount,
d.CloseDate
FROM
HubSpot.Contacts c
LEFT JOIN
HubSpot.Deals d ON c.ContactID = d.AssociatedContactID
WHERE
d.CloseDate >= DATE_SUB(CURRENT_DATE, INTERVAL 90 DAY)
This SQL query allows you to visualize your sales pipeline, lead conversion rates, and deal values in Power BI.
MongoDB Power BI
MongoDB, a popular NoSQL database, stores vast amounts of unstructured and semi-structured data. Here’s how to integrate MongoDB with Power BI using Peliqan:
- Use the MongoDB connector in Peliqan
- Provide your MongoDB connection string and credentials
- Write queries to extract the desired data
- Transform and load the data into Peliqan
- Connect Peliqan DW to Power BI using PowerBI connector
- Send the desired MongoDB data to Power BI
- Create dashboards in Power BI
Try for free >> MongoDB Connector
Example: User Behavior Analysis Dashboard
Assumptions:
- Table Used: MongoDB.EventLogs.
- Date Range: Data is queried for events in the last 30 days.
- Event Details: Events have associated user IDs, event types, and session start/end times.
- Aggregation: Data is aggregated by user ID and event type.
- Session Duration: DATEDIFF function calculates the average session duration.
Analyze user behavior patterns from MongoDB event logs. Here’s a sample query in Peliqan:
SELECT
UserID,
EventType,
COUNT(*) as EventCount,
AVG(DATEDIFF(SECOND, SessionStart, SessionEnd)) as AvgSessionDuration
FROM
MongoDB.EventLogs
WHERE
EventDate >= DATE_SUB(CURRENT_DATE, INTERVAL 30 DAY)
GROUP BY
UserID, EventType
This SQL query allows you to create visualizations in Power BI that show user engagement metrics and session durations.
LinkedIn Power BI
LinkedIn, the world’s largest professional network, provides valuable data for B2B marketers and recruiters. Here’s how to connect LinkedIn to Power BI using Peliqan:
- Use the LinkedIn connector in Peliqan
- Authenticate with your LinkedIn account
- Choose the relevant data (e.g., company page analytics, ad performance)
- Transform and load the data into Peliqan
- Connect Peliqan DW to Power BI using PowerBI connector
- Send the desired LinkedIn data to Power BI
- Create dashboards in Power BI
Try for free >> LinkedIn Connector
Example: LinkedIn Marketing Performance Dashboard
Assumptions:
- Table Used: LinkedIn.CompanyPageAnalytics.
- Date Range: Data is queried for the last 90 days.
- Metrics: Metrics include followers, impressions, clicks, and engagement rates.
- Data Order: Data is ordered by date and reach.
Create a dashboard that tracks your LinkedIn marketing efforts. Here’s a sample query in Peliqan:
SELECT
Date,
Followers,
Impressions,
Clicks,
Engagements,
CTR
FROM
LinkedIn.CompanyPageAnalytics
WHERE
Date >= DATE_SUB(CURRENT_DATE, INTERVAL 90 DAY)
ORDER BY
Date DESC
This SQL query allows you to visualize your LinkedIn follower growth, post engagement rates, and ad performance in Power BI.
Google Sheets Power BI
Google Sheets is a versatile collaborative spreadsheet tool used by many organizations. Here’s how to connect Google Sheets to Power BI with Peliqan:
- Use the Google Sheets connector in Peliqan
- Authenticate your Google account
- Select the desired spreadsheet and range
- Transform and load the data into Peliqan
- Connect Peliqan DW to Power BI using PowerBI connector
- Send the desired Google Sheets data to Power BI
- Create dashboards in Power BI
Try for free >> Google Sheets Connector
Example: Sales Forecast Dashboard
Assumptions:
- Table Used: GoogleSheets.SalesForecast.
- Date Range: Data is queried for current and future dates.
- Metrics: Includes actual and forecasted sales amounts.
- Variance Calculation: The variance between actual and forecasted sales is computed.
Create a dynamic sales forecast dashboard using data from a Google Sheet. Here’s a sample query in Peliqan:
SELECT
Date,
Product,
ActualSales,
ForecastSales,
(ActualSales - ForecastSales) as Variance
FROM
GoogleSheets.SalesForecast
WHERE
Date >= CURRENT_DATE()
ORDER BY
Date, Product
This SQL query allows you to create visualizations in Power BI that compare actual sales against forecasts and track variances over time.
Odoo Power BI
Odoo, an open-source ERP and CRM system, contains comprehensive business data. Here’s how to integrate Odoo with Power BI using Peliqan:
- Use the Odoo connector in Peliqan
- Provide your Odoo server details and credentials
- Select the relevant Odoo models and fields
- Transform and load the data into Peliqan
- Connect Peliqan DW to Power BI using PowerBI connector
- Send the desired Odoo data to Power BI
- Create dashboards in Power BI
Try for free >> Odoo Connector
Example: Inventory and Sales Performance Dashboard
Assumptions:
- Tables Used: Odoo.Products, Odoo.Stock, Odoo.Warehouses, Odoo.SaleOrderLines.
- Join Keys: ProductID links stock and sales; WarehouseID links stock to warehouses.
- Date Range: Data is queried for the last 30 days.
- Product Information: Includes product names and inventory details.
- Sales and Revenue: Includes quantities sold and revenue.
Develop a dashboard that combines inventory levels and sales performance. Here’s a sample query in Peliqan:
SELECT
p.Name as ProductName,
s.Quantity as StockQuantity,
s.ReorderPoint,
w.Name as Warehouse,
SUM(so.Quantity) as SoldQuantity,
SUM(so.PriceTotal) as Revenue
FROM
Odoo.Products p
JOIN
Odoo.Stock s ON p.ProductID = s.ProductID
JOIN
Odoo.Warehouses w ON s.WarehouseID = w.WarehouseID
LEFT JOIN
Odoo.SaleOrderLines so ON p.ProductID = so.ProductID
WHERE
so.Date >= DATE_SUB(CURRENT_DATE, INTERVAL 30 DAY)
GROUP BY
p.Name, s.Quantity, s.ReorderPoint, w.Name
This SQL query allows you to create Power BI visualizations that show inventory levels alongside sales performance for each product.
Airtable Power BI
Airtable, a flexible database-spreadsheet hybrid, is used by many teams for project management and data organization. Here’s how to connect Airtable to Power BI using Peliqan:
- Use the Airtable connector in Peliqan
- Provide your Airtable API key and base ID
- Select the desired tables and views
- Transform and load the data into Peliqan
- Connect Peliqan DW to Power BI using PowerBI connector
- Send the desired Airtable data to Power BI
- Create dashboards in Power BI
Try for free >> Airtable Connector
Example: Project Management Dashboard
Assumptions:
- Tables Used: Airtable.Projects and Airtable.Tasks.
- Join Key: ProjectID links tasks to projects.
- Date Range: Data includes tasks with due dates from the current date onward.
- Task Details: Includes task status, assigned team members, and due dates.
Create a dashboard that tracks project progress and resource allocation. Here’s a sample query in Peliqan:
SELECT
p.ProjectName,
t.TaskName,
t.Status,
t.AssignedTo,
t.DueDate,
t.EstimatedHours,
t.ActualHours
FROM
Airtable.Projects p
JOIN
Airtable.Tasks t ON p.ProjectID = t.ProjectID
WHERE
t.DueDate >= CURRENT_DATE()
ORDER BY
t.DueDate
This SQL query allows you to create Power BI visualizations that show project timelines, task status, and resource allocation.
Notion Power BI
Notion, an all-in-one workspace for notes, documents, and databases, contains valuable organizational data. Here’s how to integrate Notion with Power BI using Peliqan:
- Use the Notion API to export data to Peliqan
- Transform and structure the data in Peliqan
- Connect Peliqan DW to Power BI using PowerBI connector
- Send the desired Notion data to Power BI
- Create dashboards in Power BI
Try for free >> Notion Connector
Example: Knowledge Management Dashboard
Assumptions:
- Table Used: Notion.Pages.
- Date Range: Data is queried for the last 30 days.
- Metrics: Includes document views, comments, and tags.
- Popular Documents: Sorted by view count.
Develop a dashboard that tracks document usage and team collaboration. Here’s a sample query in Peliqan:
SELECT
PageTitle,
Creator,
LastEditedDate,
ViewCount,
CommentCount,
Tags
FROM
Notion.Pages
WHERE
LastEditedDate >= DATE_SUB(CURRENT_DATE, INTERVAL 30 DAY)
ORDER BY
ViewCount DESC
This SQL query allows you to create Power BI visualizations that show popular documents, active contributors, and trending topics in your Notion workspace.
Facebook Power BI
Facebook, the world’s largest social network, provides rich data for marketers and businesses. Here’s how to connect Facebook to Power BI using Peliqan:
- Use the Facebook connector in Peliqan
- Authenticate with your Facebook account
- Choose the relevant data (e.g., page insights, ad performance)
- Transform and load the data into Peliqan
- Connect Peliqan DW to Power BI using PowerBI connector
- Send the desired Facebook data to Power BI
- Create dashboards in Power BI
Try for free >> Facebook Connector
Example: Social Media Performance Dashboard
Assumptions:
- Table Used: Facebook.PostInsights.
- Date Range: Data is queried for the last 90 days.
- Metrics: Includes post reach, impressions, likes, comments, and shares.
- Data Order: Data is ordered by date and reach.
Create a dashboard that tracks your Facebook marketing efforts. Here’s a sample query in Peliqan:
SELECT
Date,
PostID,
PostType,
Reach,
Impressions,
Likes,
Comments,
Shares
FROM
Facebook.PostInsights
WHERE
Date >= DATE_SUB(CURRENT_DATE, INTERVAL 90 DAY)
ORDER BY
Date DESC, Reach DESC
This SQL query allows you to create Power BI visualizations that show post engagement, audience reach, and content performance over time.
OneDrive Power BI
OneDrive, Microsoft’s cloud storage service, often contains important business files and data. Here’s how to connect OneDrive to Power BI using Peliqan:
- Use the OneDrive connector in Peliqan
- Authenticate your OneDrive account
- Navigate to and select the desired files
- Transform and load the data into Peliqan
- Connect Peliqan DW to Power BI using PowerBI connector
- Send the desired OneDrive data to Power BI
- Create dashboards in Power BI
Try for free >> OneDrive Connector
Example: File Usage and Collaboration Dashboard
Assumptions:
- Table Used: OneDrive.Files.
- Date Range: Data is queried for the last 30 days.
- Metrics: Includes file access count, collaborators, and modifications.
- File Information: Includes file names, types, and access details.
Develop a dashboard that tracks file usage and team collaboration. Here’s a sample query in Peliqan:
SELECT
FileName,
FileType,
CreatedBy,
LastModifiedDate,
LastModifiedBy,
AccessCount,
SharedWithCount
FROM
OneDrive.Files
WHERE
LastModifiedDate >= DATE_SUB(CURRENT_DATE, INTERVAL 30 DAY)
ORDER BY
AccessCount DESC
This SQL query allows you to create Power BI visualizations that show popular files, active contributors, and collaboration patterns in your OneDrive.
AFAS Power BI
AFAS, a comprehensive business software suite popular in the Benelux region, contains a wealth of business data. Here’s how to connect AFAS to Power BI using Peliqan:
- Use the AFAS connector in Peliqan
- Provide your AFAS environment details and credentials
- Select the relevant AFAS objects and fields
- Transform and load the data into Peliqan
- Connect Peliqan DW to Power BI using PowerBI connector
- Send the desired AFAS data to Power BI
- Create dashboards in Power BI
Try for free >> AFAS Connector
Example: Financial and HR Performance Dashboard
Assumptions:
- Tables Used: AFAS.FinancialTransactions, AFAS.Budget, AFAS.Employees.
- Join Keys: AccountCode links financial transactions to budget; Department links transactions to employees.
- Date Range: Data is queried for transactions in the last 90 days.
- Financial and HR Metrics: Includes financial amounts and employee counts.
Create a dashboard that combines financial and HR data. Here’s a sample query in Peliqan:
SELECT
f.AccountCode,
f.Description,
f.Amount as ActualAmount,
b.Amount as BudgetedAmount,
e.Department,
COUNT(e.EmployeeID) as EmployeeCount
FROM
AFAS.FinancialTransactions f
JOIN
AFAS.Budget b ON f.AccountCode = b.AccountCode
JOIN
AFAS.Employees e ON f.Department = e.Department
WHERE
f.TransactionDate >= DATE_SUB(CURRENT_DATE, INTERVAL 90 DAY)
GROUP BY
f.AccountCode, f.Description, f.Amount, b.Amount, e.Department
This SQL query allows you to create Power BI visualizations that show financial performance alongside workforce metrics.
Snowflake Power BI
Snowflake, a cloud-based data warehousing platform, offers powerful analytics capabilities. Here’s how to connect Snowflake to Power BI using Peliqan:
- Use the Snowflake connector in Peliqan
- Provide your Snowflake account details and credentials
- Select the relevant Snowflake databases, schemas, and tables
- Transform and load the data into Peliqan
- Connect Peliqan DW to Power BI using PowerBI connector
- Send the desired Snowflake data to Power BI
- Create dashboards in Power BI
Try for free >> Snowflake Connector
Example: Data Warehouse Analytics Dashboard
Assumptions:
- Tables Used: Snowflake.Sales, Snowflake.Products, Snowflake.Customers
- Join Keys: ProductID links Sales to Products; CustomerID links Sales to Customers
- Date Range: Data is queried for sales in the last 365 days
- Metrics: Includes sales amount, quantity sold, and customer information
- Data Volume: Assumes large-scale data processing capabilities
Create a comprehensive analytics dashboard using your Snowflake data warehouse. Here’s a sample query in Peliqan:
SELECT
s.SaleDate,
p.ProductName,
p.Category,
s.QuantitySold,
s.SaleAmount,
c.CustomerName,
c.Region
FROM
Snowflake.Sales s
JOIN
Snowflake.Products p ON s.ProductID = p.ProductID
JOIN
Snowflake.Customers c ON s.CustomerID = c.CustomerID
WHERE
s.SaleDate >= DATEADD(day, -365, CURRENT_DATE())
This SQL query allows you to create Power BI visualizations that show sales trends, product performance, and customer segmentation across regions, leveraging Snowflake’s powerful data processing capabilities.
Redshift Power BI
Amazon Redshift, a cloud data warehouse, often stores large volumes of analytical data. Here’s how to connect Redshift to Power BI using Peliqan:
- Use the Amazon Redshift connector in Peliqan
- Provide your Redshift server details and credentials
- Write SQL queries or select tables to import
- Transform and load the data into Peliqan
- Connect Peliqan DW to Power BI using PowerBI connector
- Send the desired Redshift data to Power BI
- Create dashboards in Power BI
Try for free >> Redshift Connector
Example: Large-Scale Data Analysis Dashboard
Assumptions:
- Tables Used: Redshift.Customers, Redshift.Orders, Redshift.Products, Redshift.Locations
- Join Keys: CustomerID in links Orders to Customers; ProductID links Orders to Products; LocationID links Customers to Locations.
- Date Range: Data is queried for orders in the past 365 days
- Order Details: Includes order date, product name, quantity, and total amount
- Customer and Location Details: Includes customer information and location data
- Data Volume: Assumes Redshift can handle large volumes of data efficiently
Create a dashboard that handles large-scale data analysis from your Redshift data warehouse. Here’s a sample query in Peliqan:
SELECT
c.CustomerID,
c.CustomerName,
o.OrderDate,
p.ProductName,
o.Quantity,
o.TotalAmount,
l.City,
l.Country
FROM
Redshift.Customers c
JOIN
Redshift.Orders o ON c.CustomerID = o.CustomerID
JOIN
Redshift.Products p ON o.ProductID = p.ProductID
JOIN
Redshift.Locations l ON c.LocationID = l.LocationID
WHERE
o.OrderDate >= DATE_SUB(CURRENT_DATE, INTERVAL 365 DAY)
This SQL query allows you to create Power BI visualizations that show customer behavior patterns, product performance, and geographical sales distribution on a large scale.
Workday Power BI
Workday, a cloud-based system for finance, HR, and planning, contains critical business data. Here’s how to connect Workday to Power BI using Peliqan:
- Use the Workday connector in Peliqan
- Provide your Workday tenant URL and credentials
- Select the relevant Workday reports and data objects
- Transform and load the data into Peliqan
- Connect Peliqan DW to Power BI using PowerBI connector
- Send the desired Workday data to Power BI
- Create dashboards in Power BI
Try for free >> Workday Connector
Example: Workforce Analytics and Financial Performance Dashboard
Assumptions:
- Tables Used: Workday.Employees, Workday.PerformanceReviews, Workday.Compensation, Workday.FinancialData
- Join Keys: EmployeeID is used for linking employee data; Department links Employees to FinancialData.
- Date Range: Data is queried for performance reviews in the past 365 days
- Financial Data: Includes budget amounts and actual spend for each department
- Currency: Financial amounts are in a standard currency or converted for consistency
Develop a comprehensive dashboard that combines workforce analytics with financial performance metrics. Here’s a sample query in Peliqan:
SELECT
e.EmployeeID,
e.FullName,
e.Department,
e.JobTitle,
p.PerformanceRating,
c.CompensationAmount,
f.BudgetAmount,
f.ActualSpend
FROM
Workday.Employees e
JOIN
Workday.PerformanceReviews p ON e.EmployeeID = p.EmployeeID
JOIN
Workday.Compensation c ON e.EmployeeID = c.EmployeeID
JOIN
Workday.FinancialData f ON e.Department = f.Department
WHERE
p.ReviewDate >= DATE_SUB(CURRENT_DATE, INTERVAL 365 DAY)
This SQL query allows you to create Power BI visualizations that show employee performance metrics alongside department budgets and actual spend, providing a holistic view of your organization’s human capital and financial health.
Conclusion
By leveraging Peliqan’s powerful connectors and data transformation capabilities, you can easily integrate data from a wide variety of sources into Power BI. This enables you to create comprehensive, data-driven reports and dashboards that provide a 360-degree view of your business.
This standardized approach simplifies the data integration process, allowing you to focus on deriving insights from your data rather than struggling with complex connection setups.
Remember, the key to successful data integration is not just connecting the sources, but also properly transforming and modeling the data to create meaningful relationships and metrics. Peliqan simplifies this process by allowing you to use SQL to prepare your data before it reaches Power BI, reducing the data preparation workload within Power BI itself.
As you explore these various data connections, consider how each source can contribute to a more complete picture of your business performance. Whether you’re analyzing financial data from QuickBooks, tracking employee performance with Workday, managing customer relationships with HubSpot, or handling large-scale data analysis with Redshift, Peliqan and Power BI together provide a powerful toolkit for turning your data into actionable insights.
By mastering the art of connecting diverse data sources to Power BI through Peliqan, you’ll be well-equipped to drive data-informed decision-making across your organization, unlocking new insights and opportunities for growth. Start exploring the possibilities today, and transform the way your organization leverages its data for success!
Recent Blog Posts
Customer Stories


CIC Hospitality saves 40+ hours per month by fully automating board reports. Their data is combined and unified from 50+ sources.


Heylog integrates TMS systems with real-time 2-way data sync. Heylog activates transport data using APIs, events and MQTT.


Globis SaaS ERP activates customer data to predict container arrivals using machine learning.