


A Snowflake data warehouse is often used to provide data for a BI tool such as Microsoft Power BI, Tableau, Qlik, Looker or Metabase to perform data analytics, build dashboards with charts and reports. While BI tools provide many advantages, it is often also desired to make data from the data warehouse available in a spreadsheet such as Google Sheets.
In this article we will discuss how Snowflake can be used in combination with Google Sheets. We’ll discuss how to connect Google Sheets files to Snowflake, and how to write data from Snowflake into Google Sheets. We’ll talk about practical and organizational implications, as well as how to set up a technical implementation with e.g. low-code Python scripts.
Build reports in Google Sheets
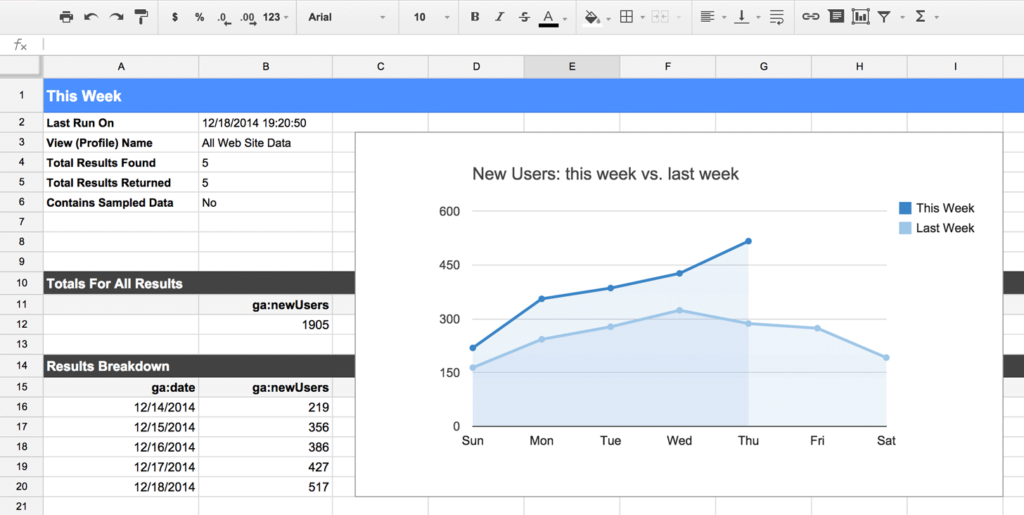
Google Sheets can be used to deliver data from Snowflake (or any other data warehouse) to business teams, allowing them to build their own reports, perform ad hoc analysis, and work with the data in a self-service manner. Often this is the optimal solution to enable self-service analytics. This approach is also referred to as “Spreadsheet-based BI”.
Comparison between BI and a spreadsheet
Classic BI tools are well suited for visualization of big data and complex analytical use cases. However, spreadsheets are often a great alternative to deliver personalized reports.
Benefits of BI
- Strong dashboarding capabilities
- Easy to roll up on dimensions, combine facts and dimensions, filtering etc.
Weakness of BI
- BI tools have a learning curve
- Dashboards and reports are often not suited for ad-hoc analysis
- BI dashboards and reports are often read-only, not optimized for data entry
- No access to the underlying data (or even raw data) to perform a specific analysis and “work” with the data
Benefits of Spreadsheets for reporting
- Everyone knows how to work with Google Sheet
- Spreadsheets have strong built-in capabilities to work with data
- Power users can work with pivots
- Easy to also add data, add columns etc.
Weakness of Spreadsheets for reporting
- Risk of breaking reports, e.g. by alerting formulas
- Reports can quickly become messy, spreadsheets are often “broken”
- Not suited for classic BI-style dashboarding based on a star schema with fact tables and dimensions.
- More difficult to protect data
Technical implementation: writing data from Snowflake into Google Sheets
There are different ways to write data from Snowflake into Google Sheets as the “target”:
- Setup an ETL pipeline with Google Sheets as target
- Use a script, this allows for more flexibility and custom automation, e.g. creating a report per department or region etc.
A similar approach is applicable when writing data to Google Sheets from BigQuery, Redshift, Azure Synapse or databases such as Postgres, SQL Server or MySQL. In some cases, for scalable data movement into reporting tools like Google Sheets, teams also take help from experienced Snowflake implementation partners to avoid mistakes.
Scripting to write data to Google Sheets
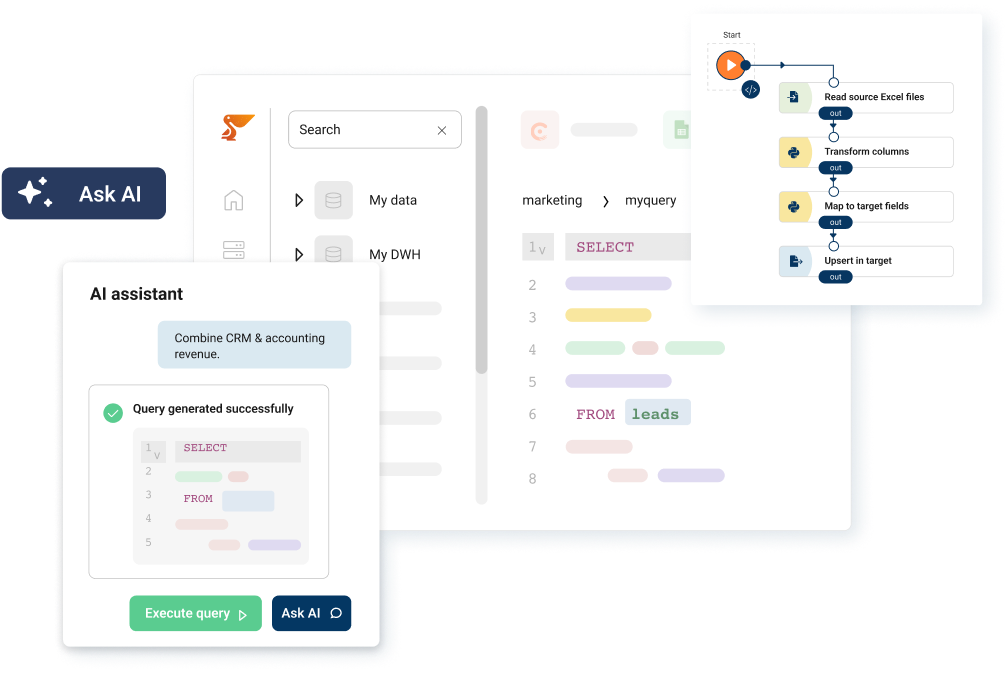
Writing data to Google Sheet files using a script allows for more flexibility, compared to an ETL pipeline. We’ll use Python to show how to write data, using the Peliqan low-code pip module, which provides wrapper functions for the Google Sheets API. It abstracts away the complexity of handling the API (oAuth authorization, handling paging, handling error codes, building up POST payload bodies in JSON etc.).
Best practices on building reports in Google Sheets
Write to “data sheets” and use VLOOKUP in reports
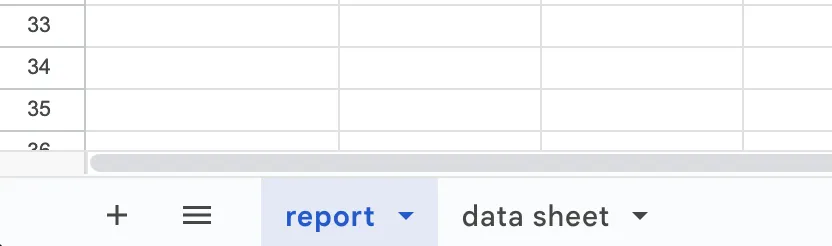
A good practice is to write your data to separate sheets (the “data sheets”) in Google Sheets that you label as read-only. This allows you to clear the entire sheet before writing a new update of the data, making sure that no data from a previous run is still present in the Google Sheets. In the actual reporting sheets, you can use the VLOOKUP formula to look up the required values.
VLOOKUP with lookup on multiple columns
A common issue with VLOOKUP is that it can only look up values using one lookup column and not a combination of columns. Therefore you might have to add a “lookup” column in the data sheet which concatenates multiple cells.
Here’s a basic example, the report uses a VLOOKUP which concatenates the different lookup values (product & city):
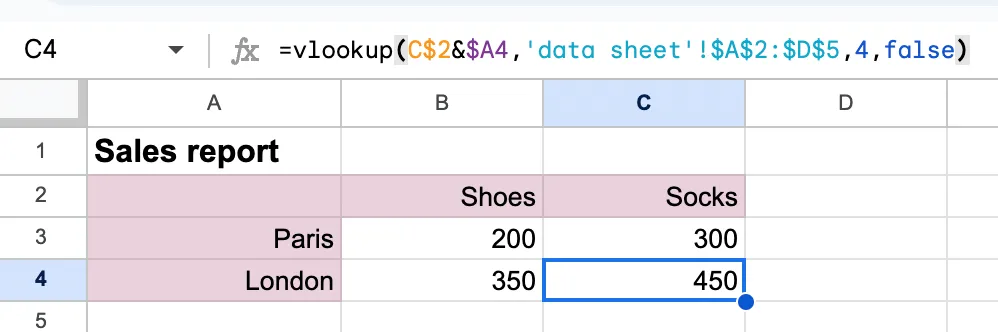
This is the VLOOKUP formula that is used in the above report:
=vlookup(C$2&$A4,’data sheet’!$A$2:$D$5,4,false)
And here is the “data sheet” (or “lookup sheet”), where a lookup column — in grey — has been added, which also concatenates the different dimension columns:
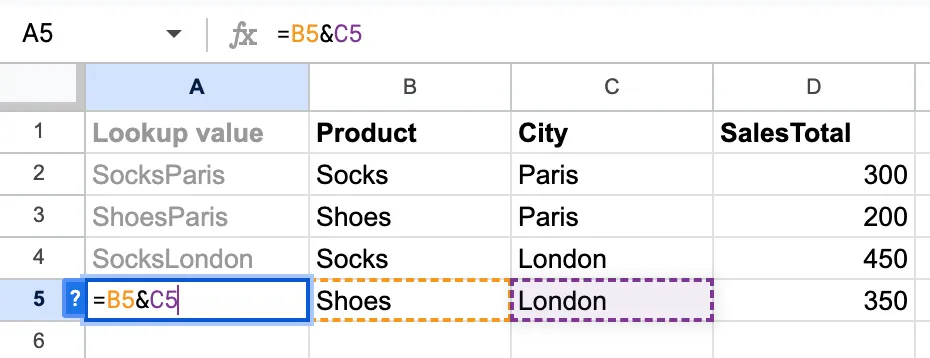
This is the formula that is used to build up the above “Lookup value” column by concatenating two columns: =B5&C5
Handling Google Sheet limitations
A Google Sheet is limited to 10 million cells. The maximum number of rows depends on the number of columns and vice versa. However, from a practical point of view, limit your Google Sheets to roughly one hundred thousand rows. When you have more rows, loading, filtering etc. will become very slow.
If your data has more rows, transform it first, for example do a rollup (aggregation) and write that result to Google Sheets. Do rollups at the granularity level in the data warehouse before writing to a Google Sheet.
Rollup your data before writing to Google Sheets
Example: you want to report on eCommerce sales and you have 20 million sales in total. Instead of writing those 20 million rows to Google Sheets, make a sum of sales by date and write that to one sheet. Do another rollup by product and write it to a second sheet.
Here are examples of basic SQL queries that transform the data.
Sharding: split data into multiple sheets
You can also perform “Sharding” which means you split up the data and write into multiple sheets. A common scenario is to split up the data by year, so you end up with a sheet “2023”, “2024”, etc.
Conclusion
Google Sheets is an excellent tool to build personalized reports for business users, because it’s a tool that many people are comfortable with, to dive into the data and do their own analysis. This concept is also called “Spreadsheet BI” and an excellent alternative to deliver data from your Snowflake data warehouse to business teams. A low-code platform such as Peliqan.io makes it easy to sync data from Snowflake into Google Sheets.
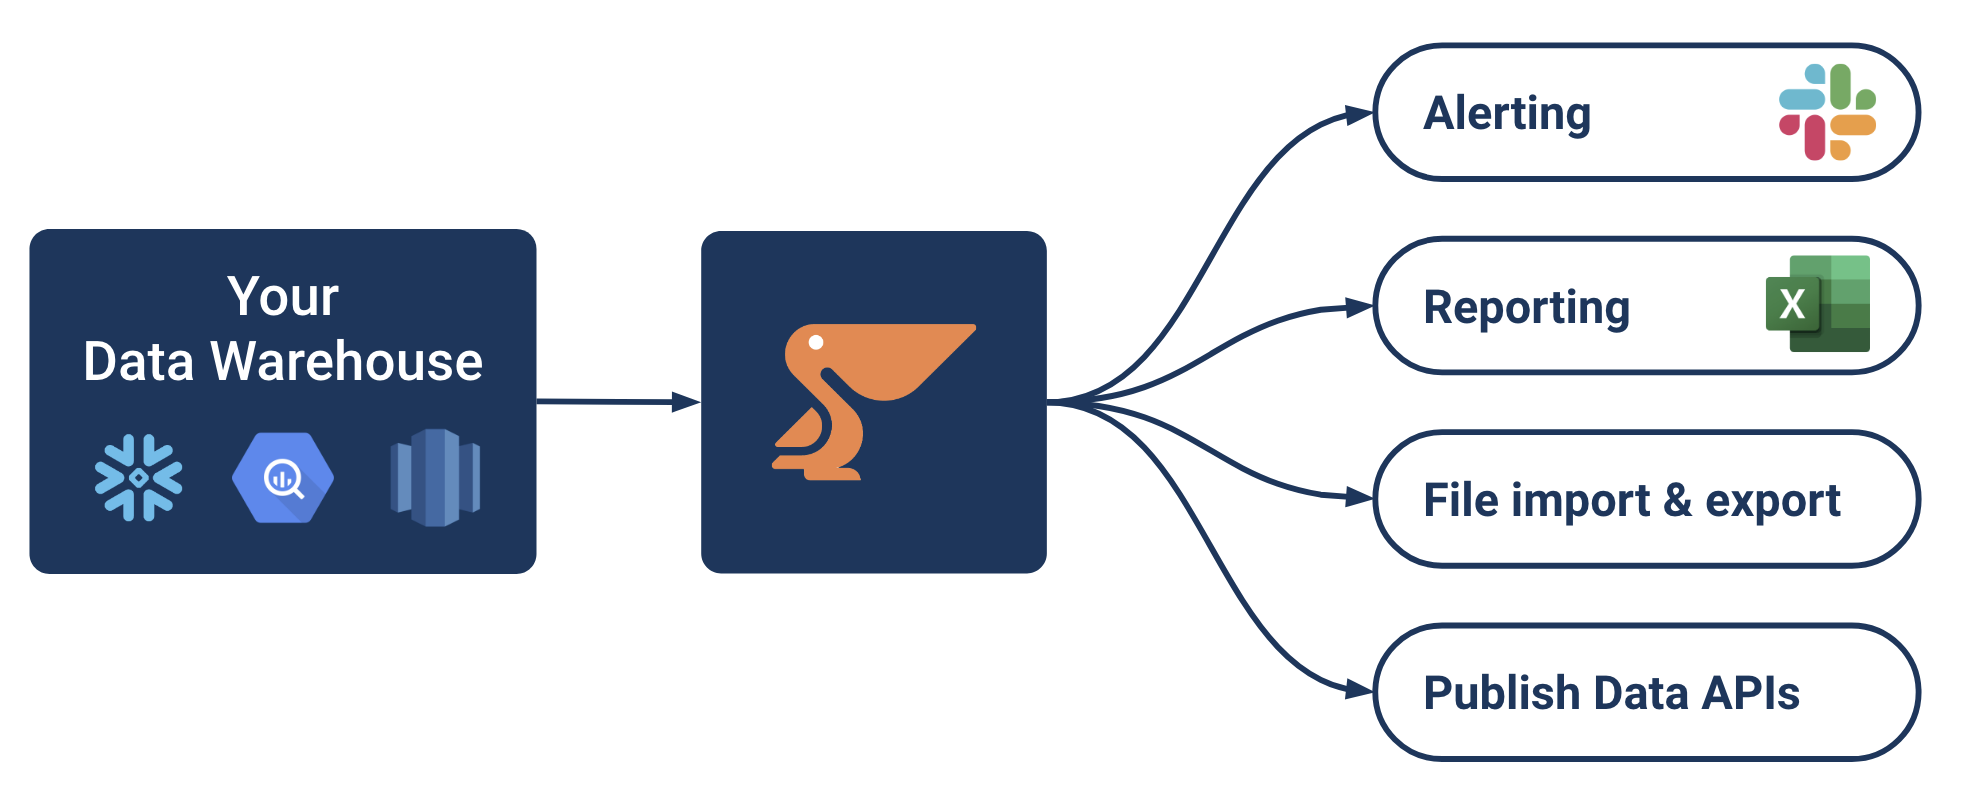
Syncing data into Google Sheets is just one of many Data Activation use cases that Peliqan.io enables.