


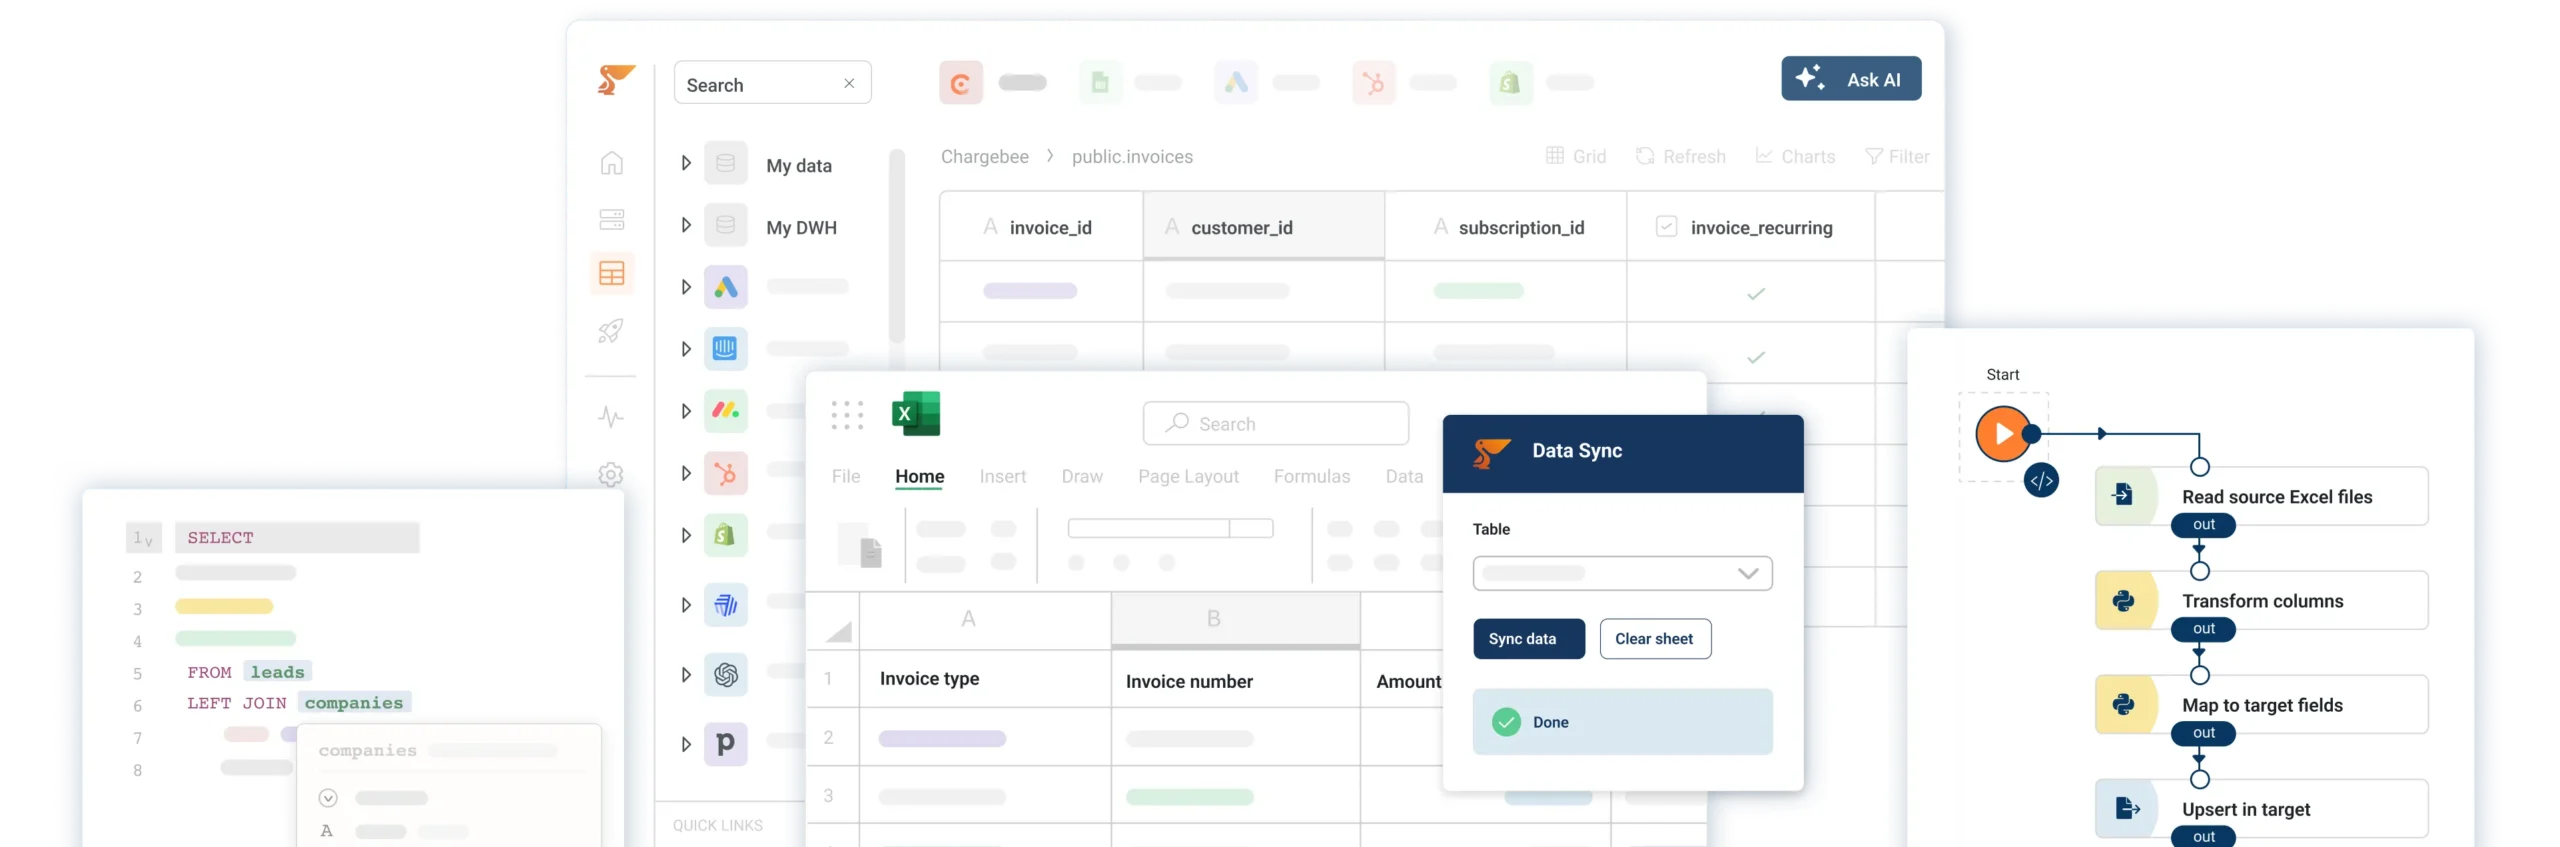
Build AI Agents on Excel 365
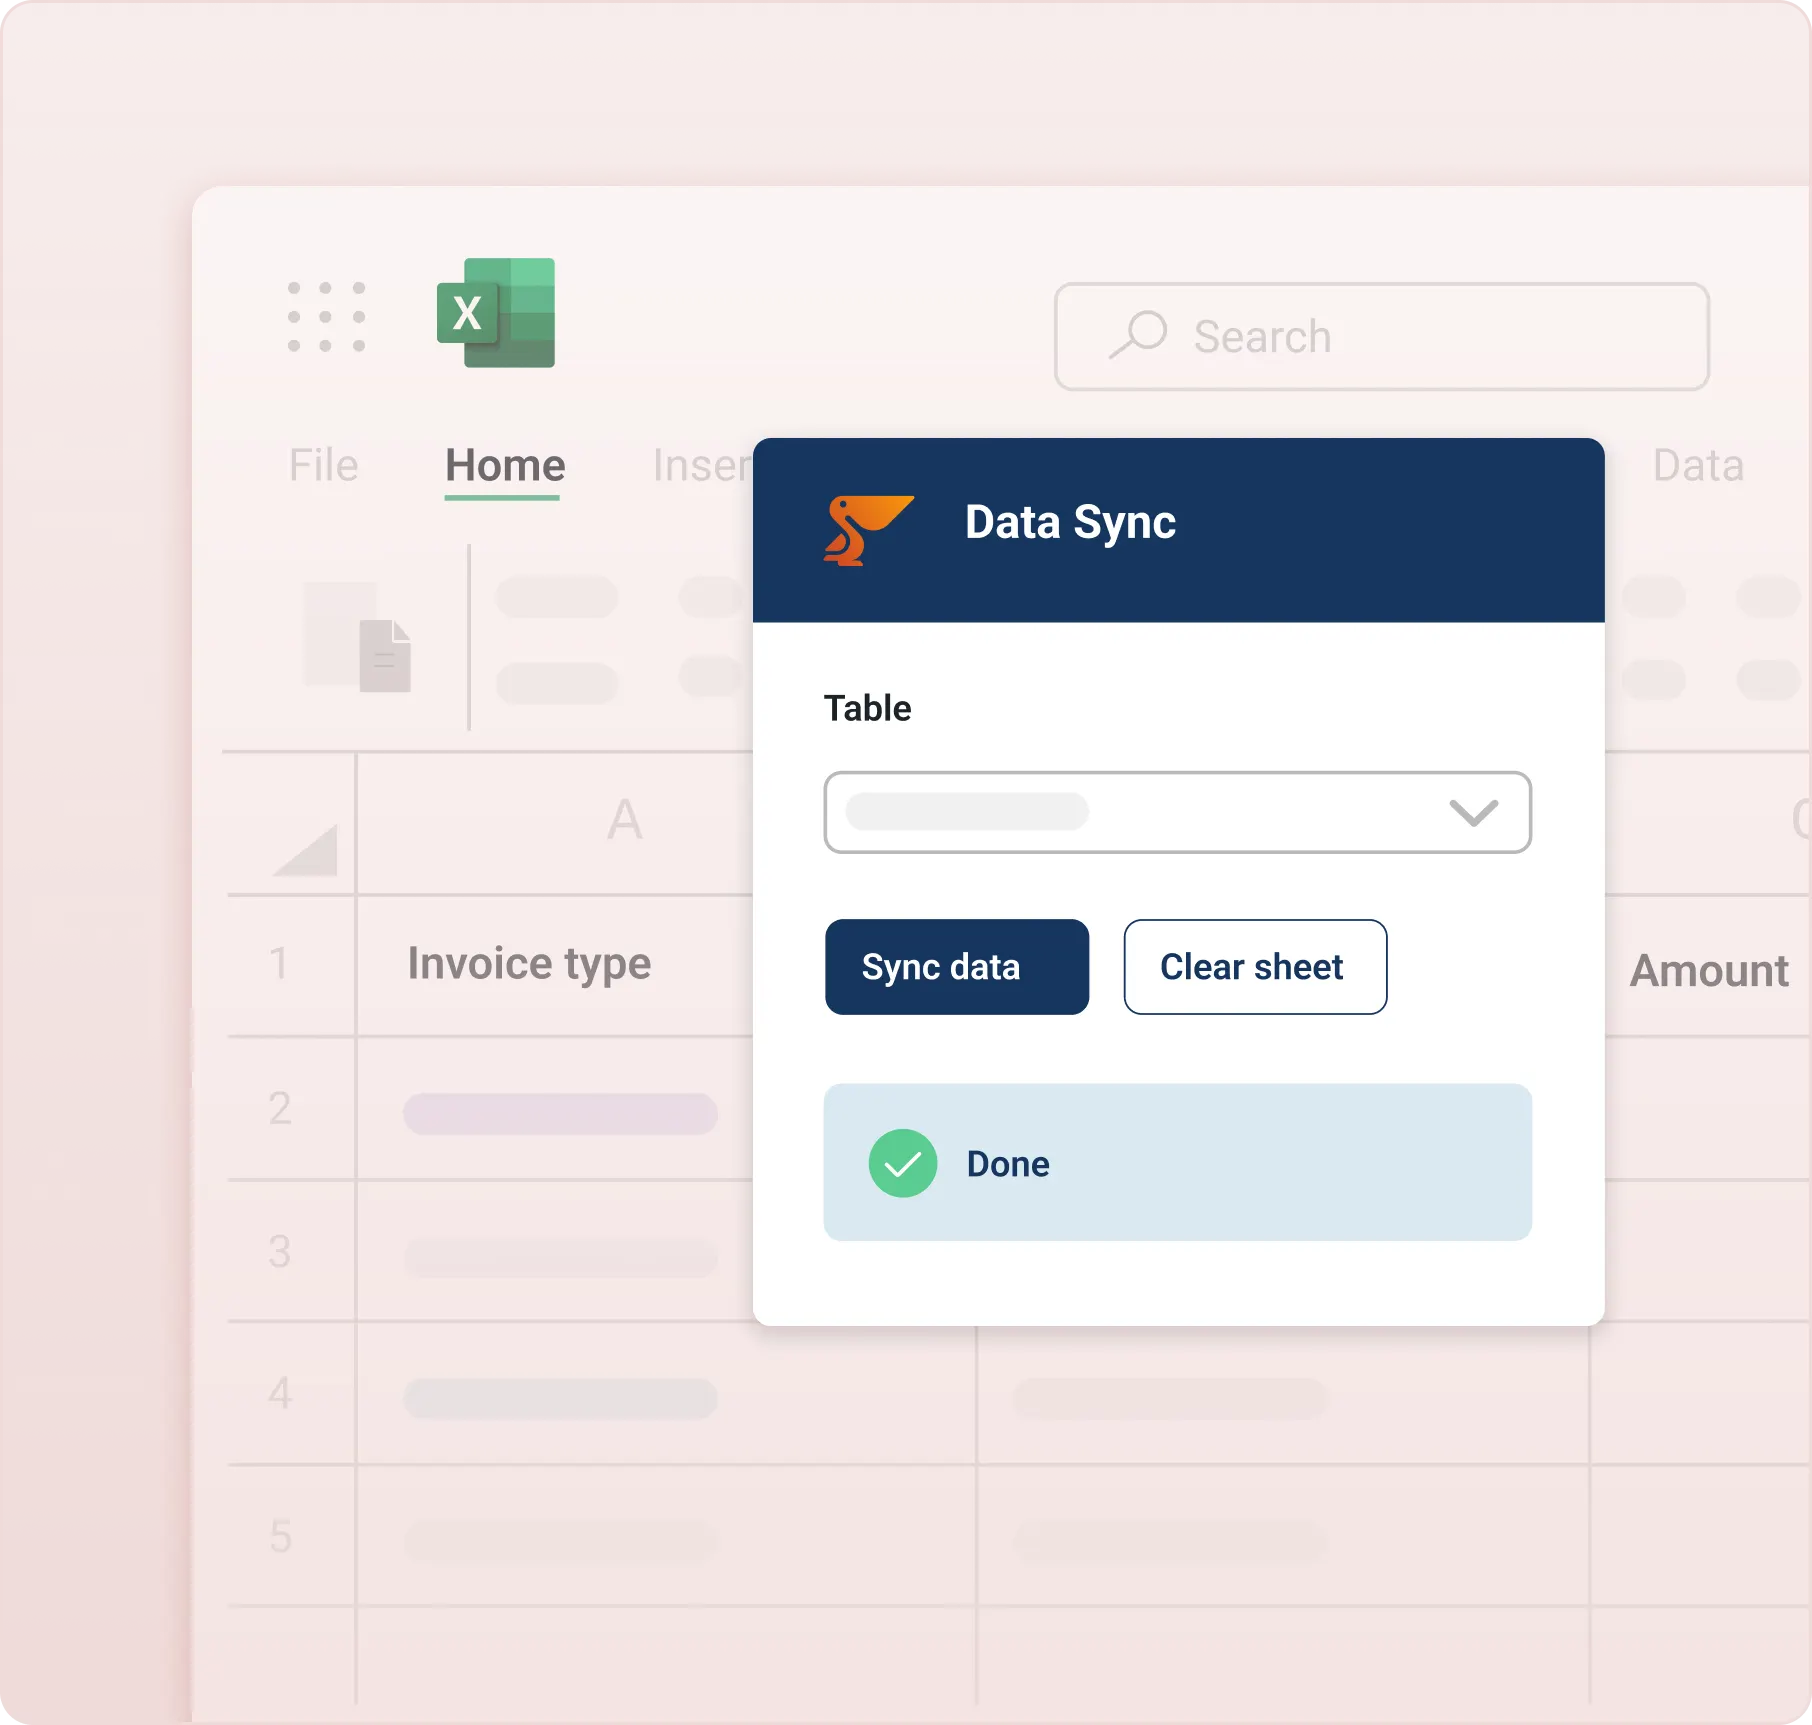
Sync data into Excel 365
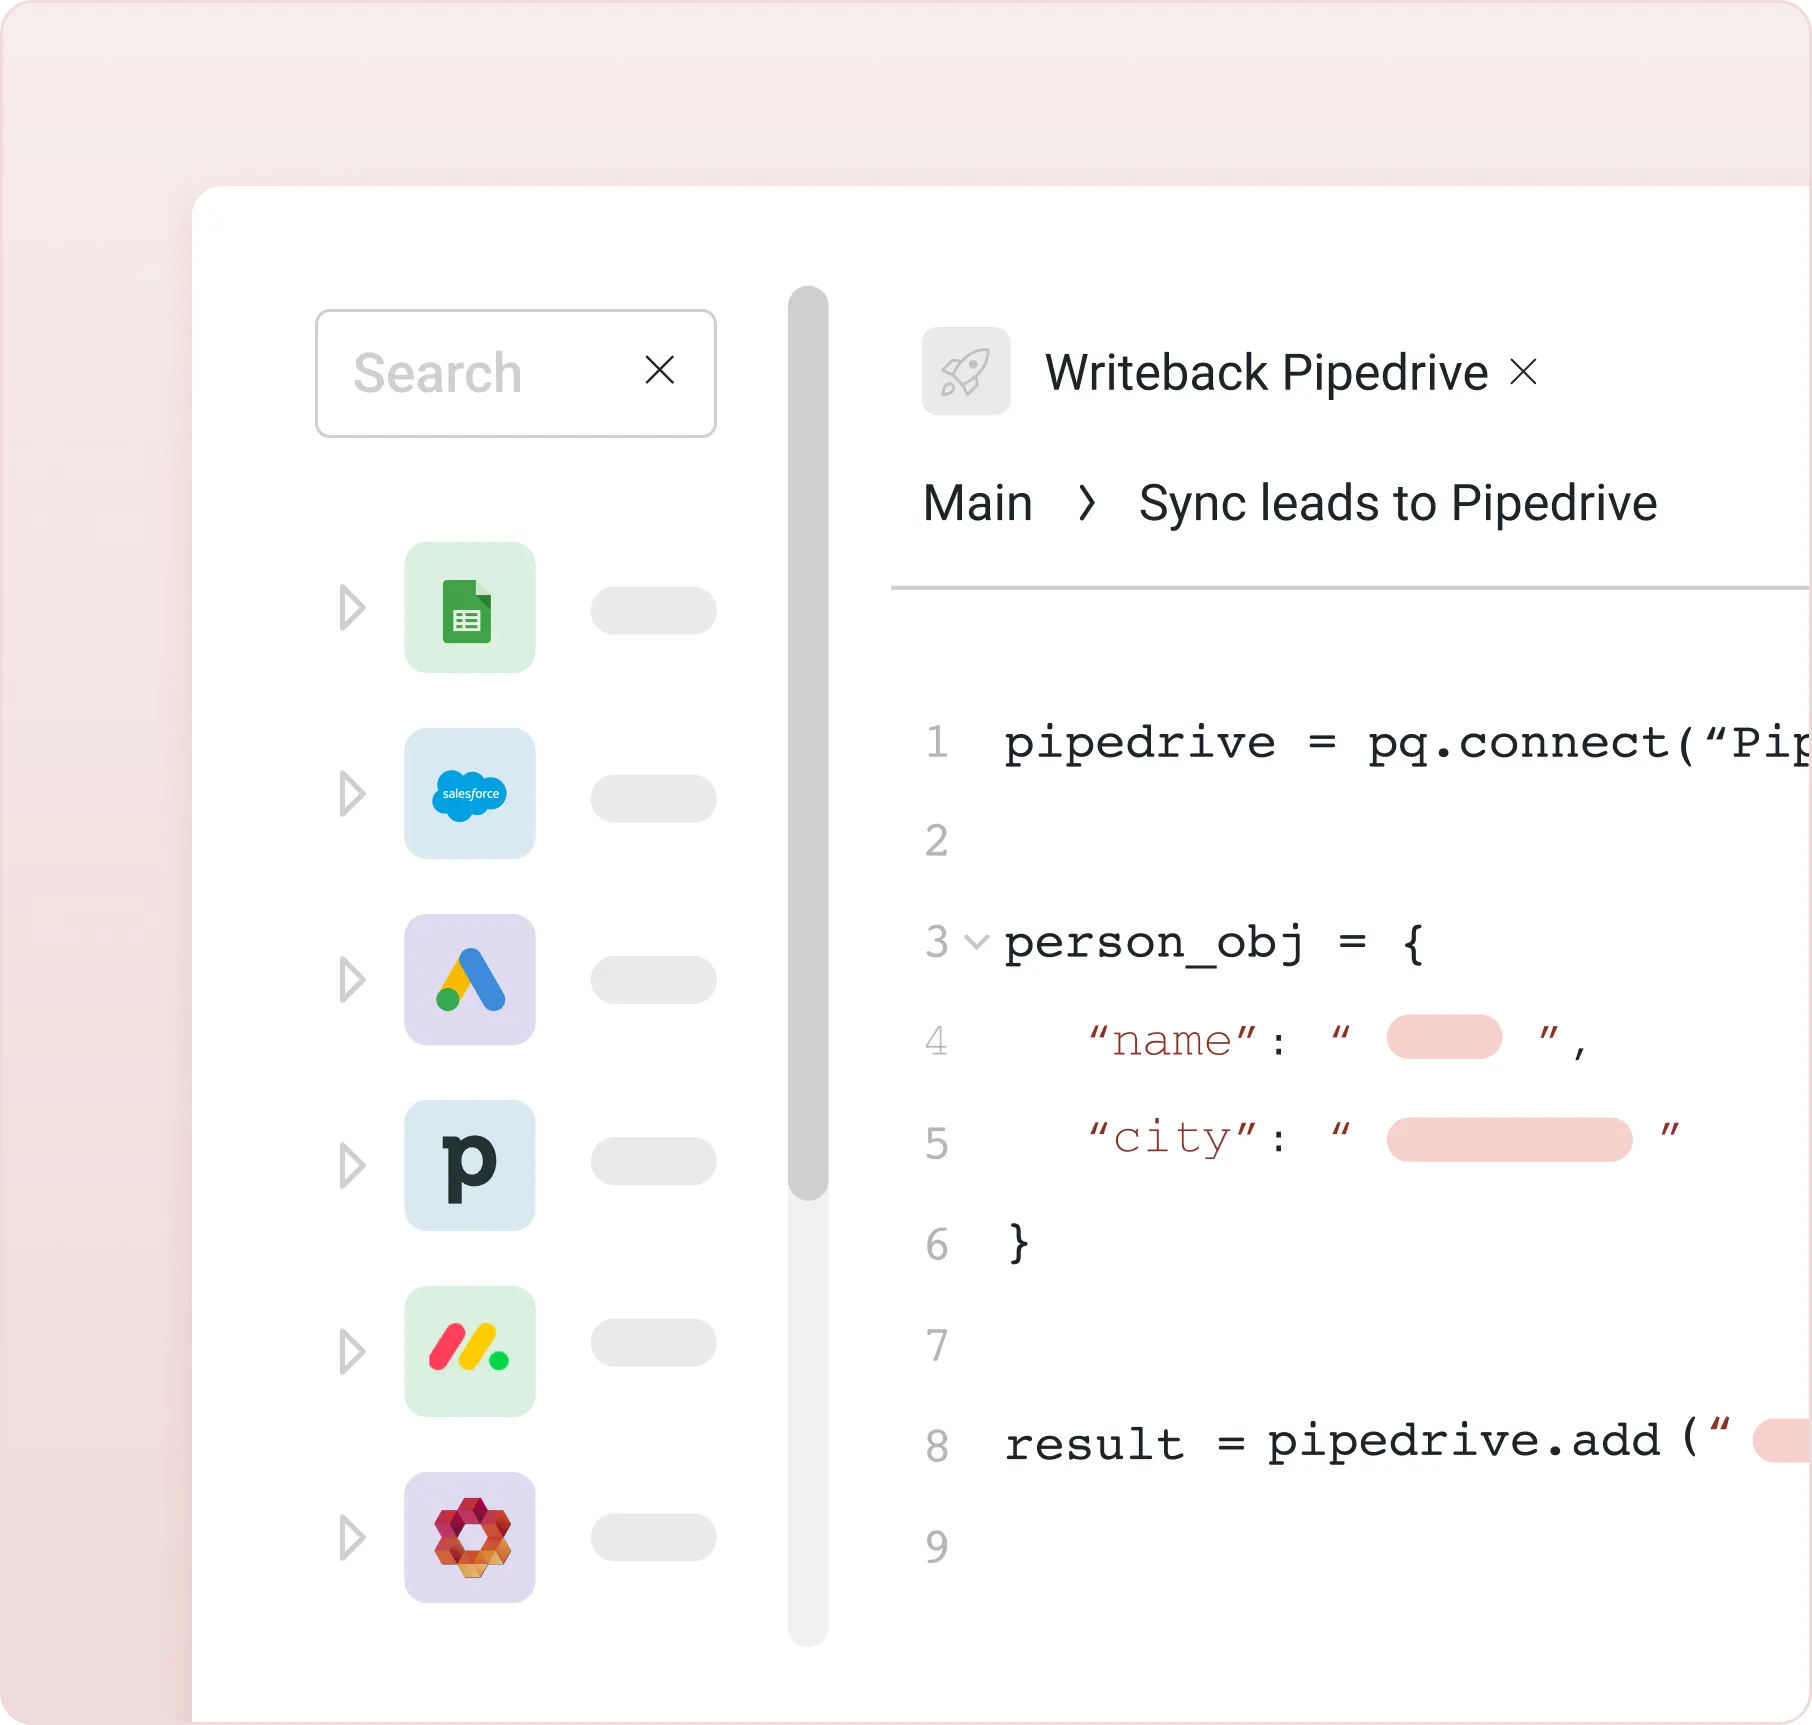
Low-code Python for developers
Work with Excel 365 data in Excel


")
")


Ad hoc analysis
Analyze your Salesforce data with SQL or in a spreadsheet.

Self-service access
Enable business users with controlled self-service data access to Salesforce.

Spreadsheet BI
Work with your Salesforce data in a spreadsheet that is always up-to-date.
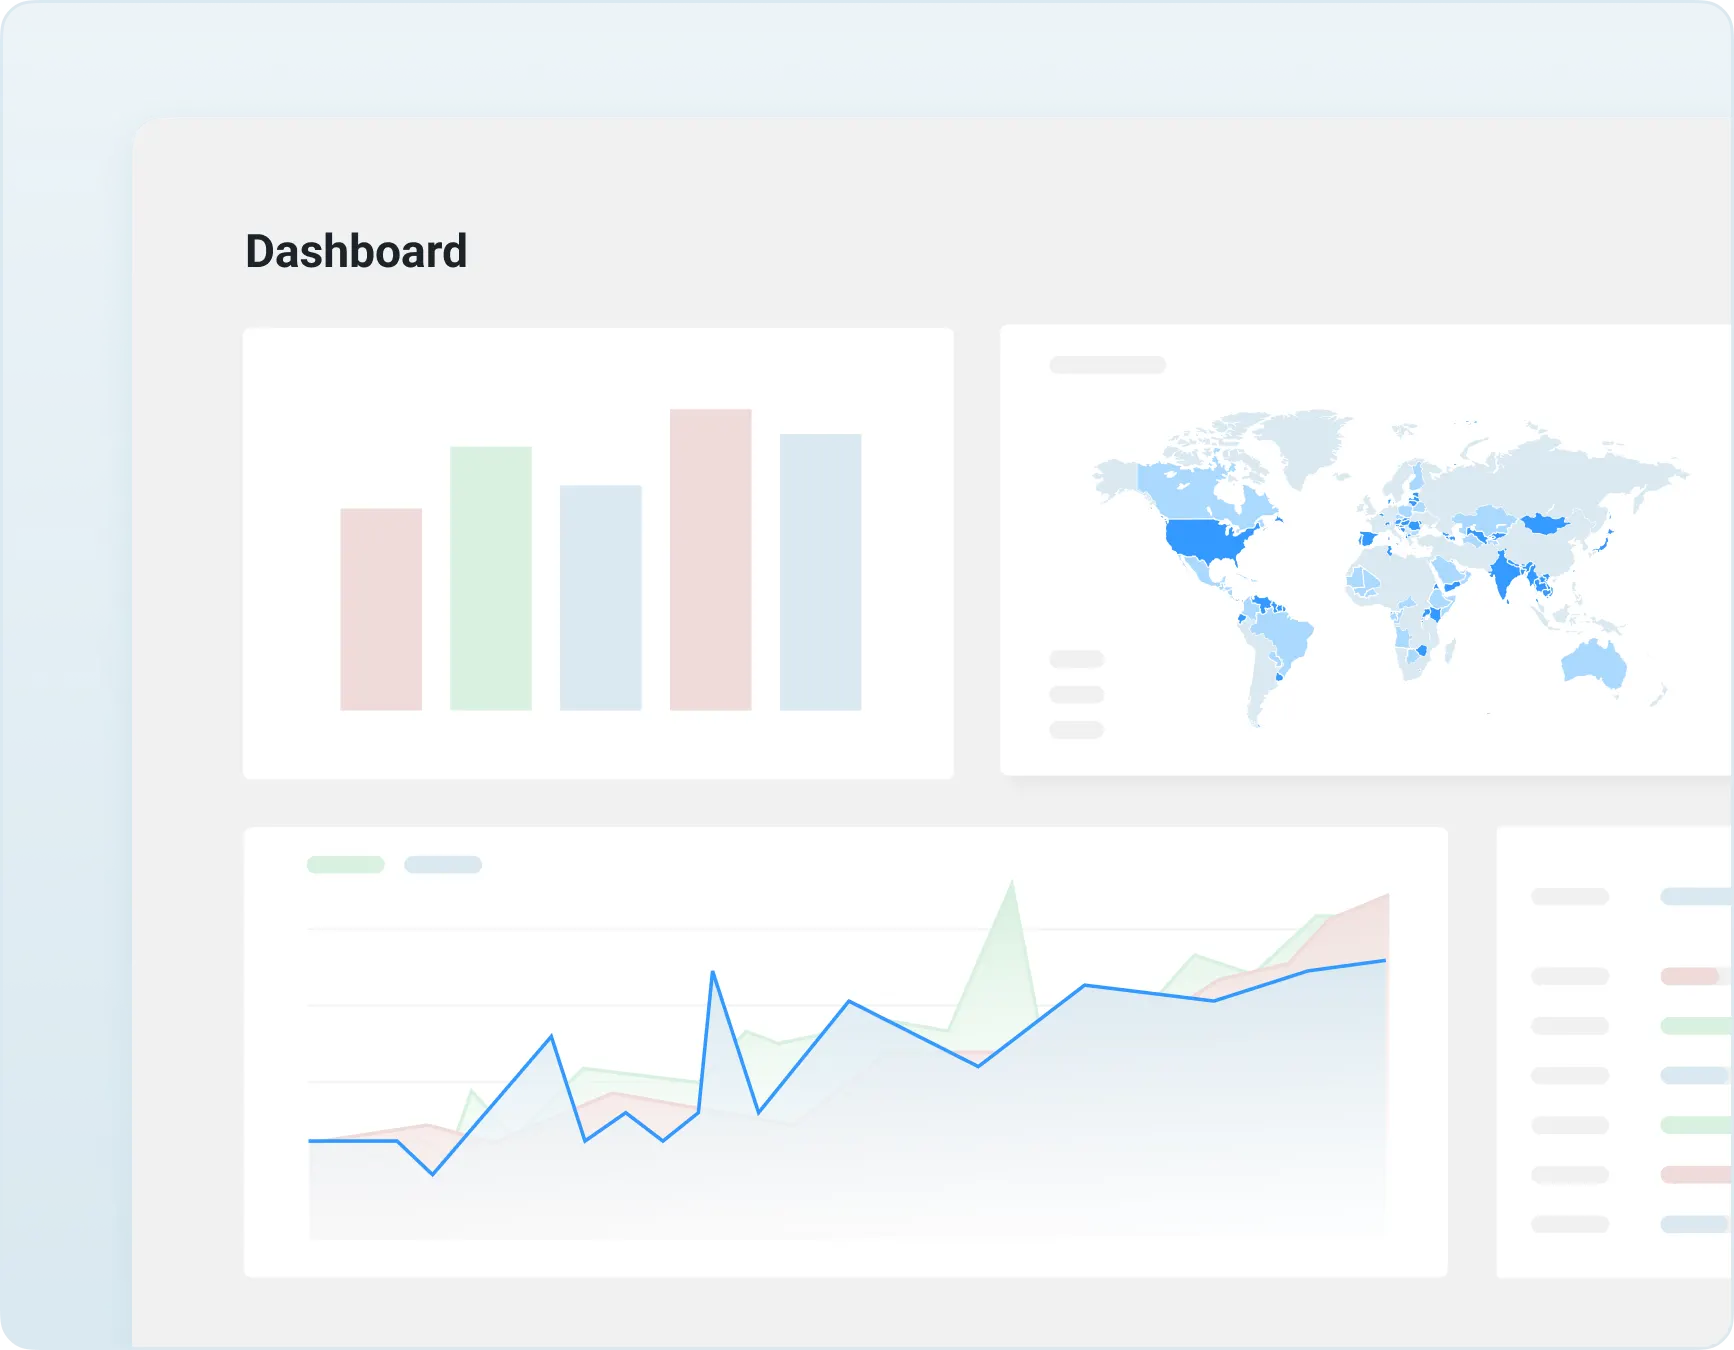
Dashboards
Create charts and visualize your Salesforce data in dashboards.

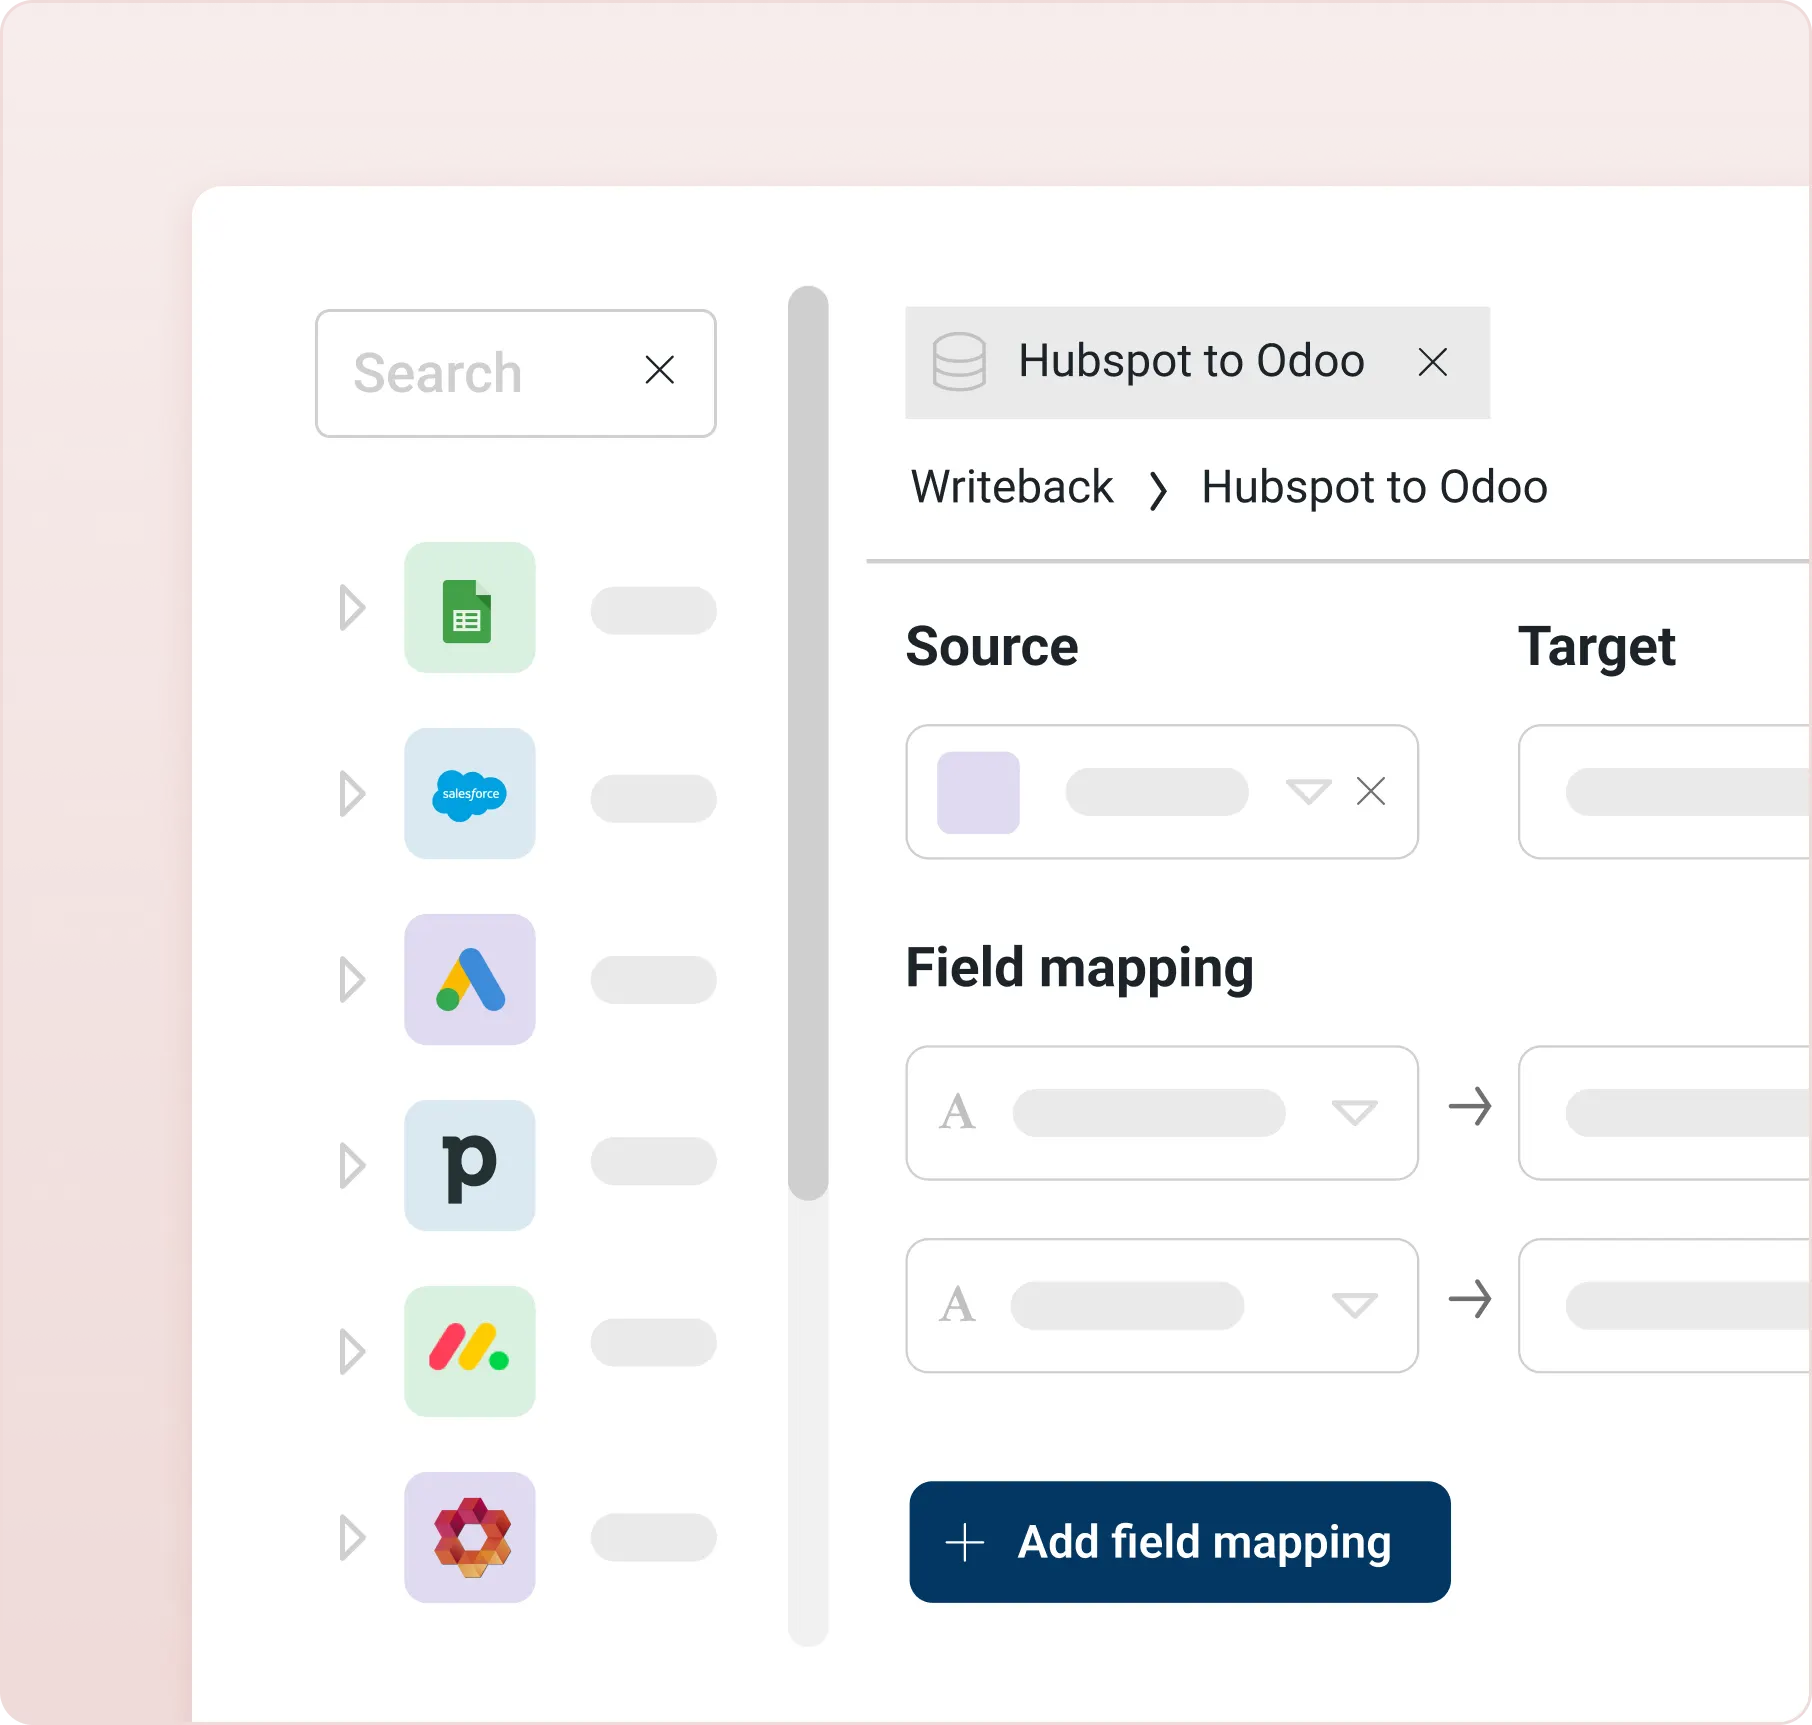
Data verification
Create views for “human in the loop” processes when working with Salesforce data.
Reporting
Build custom reports from Salesforce in HTML, PDF…

Reconciliation
Reconcile your Salesforce data with other sources.

Machine learning
Apply machine learning models on your Salesforce data with low-code python.

Low-code data apps
Build internal apps to make data from Salesforce interactive.

Data front-ends
Replace complex user interfaces with a targeted UI for knowledge workers using Salesforce.
Reverse ETL
Implement reverse ETL flows to send data from Salesforce to any SaaS.
Direct data access
Get real-time access to your raw Salesforce data.

Migrations
Implement data migrations to or from Salesforce using SQL and low-code Python.
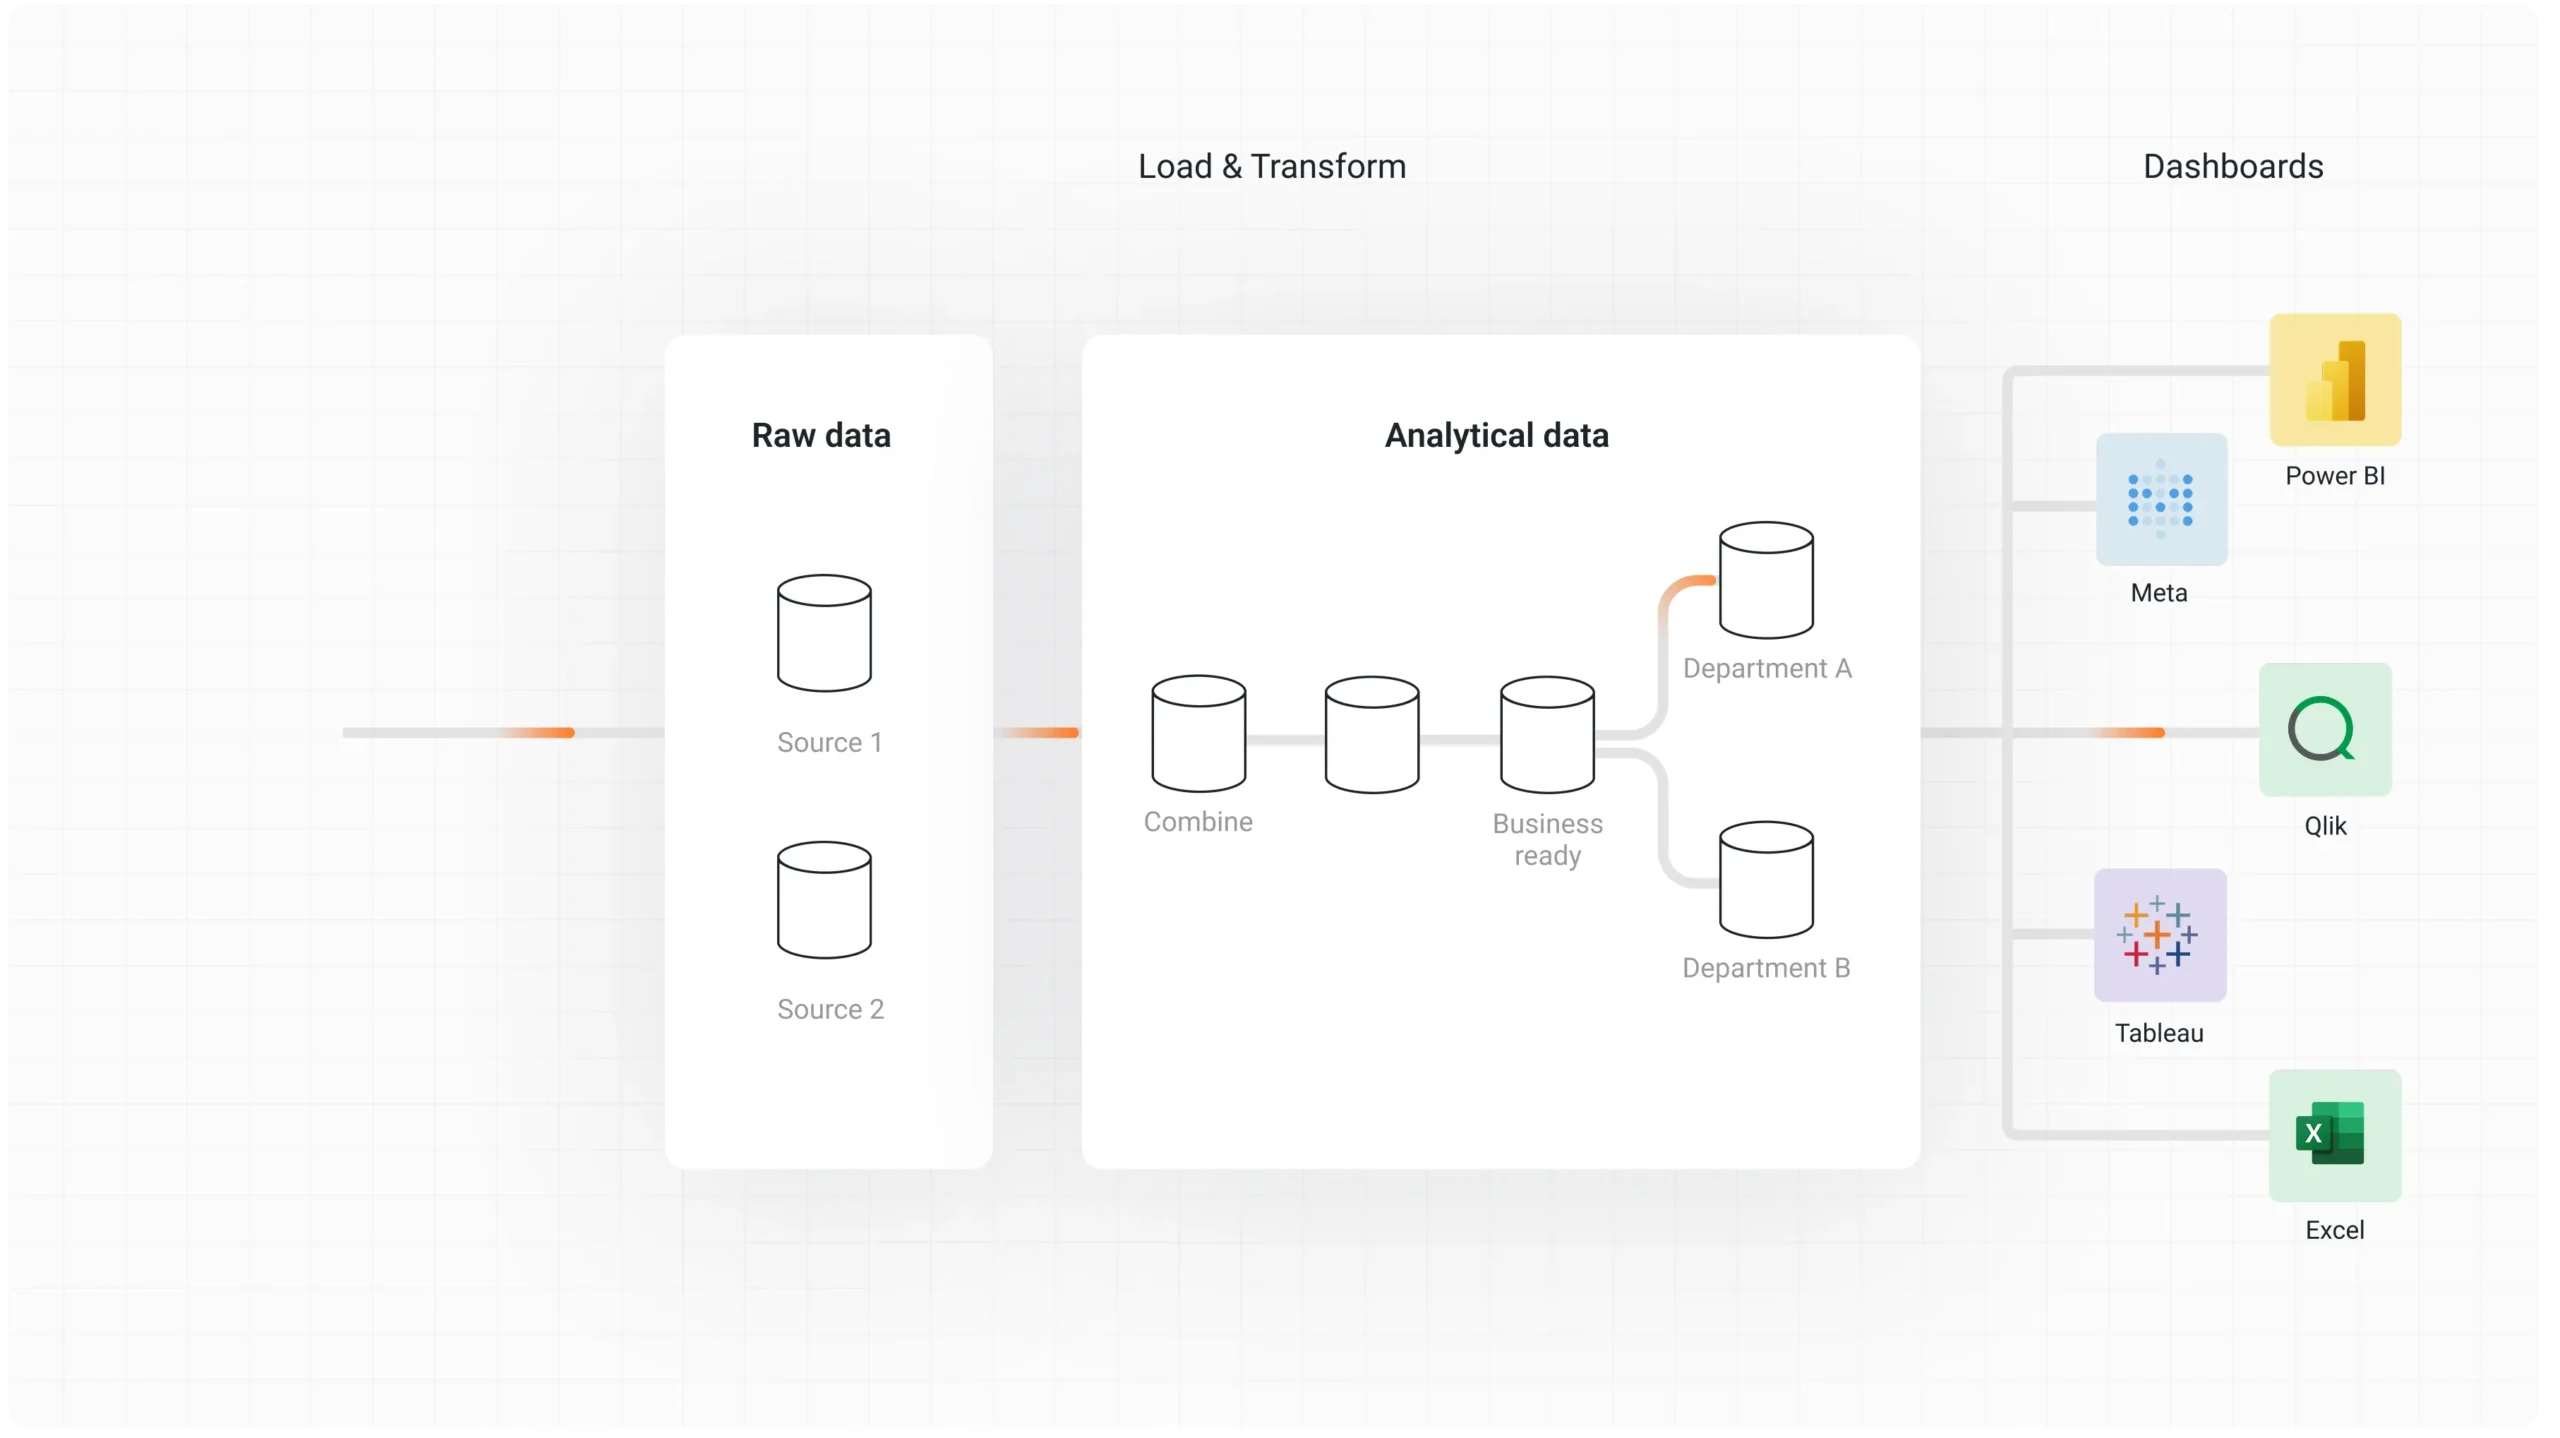
All-in-one data stack
Peliqan is an all-in-one data stack on top Salesforce, SaaS apps and DBs.
Data warehouse
Get your Salesforce data in a data warehouse instantly, with a few clicks.
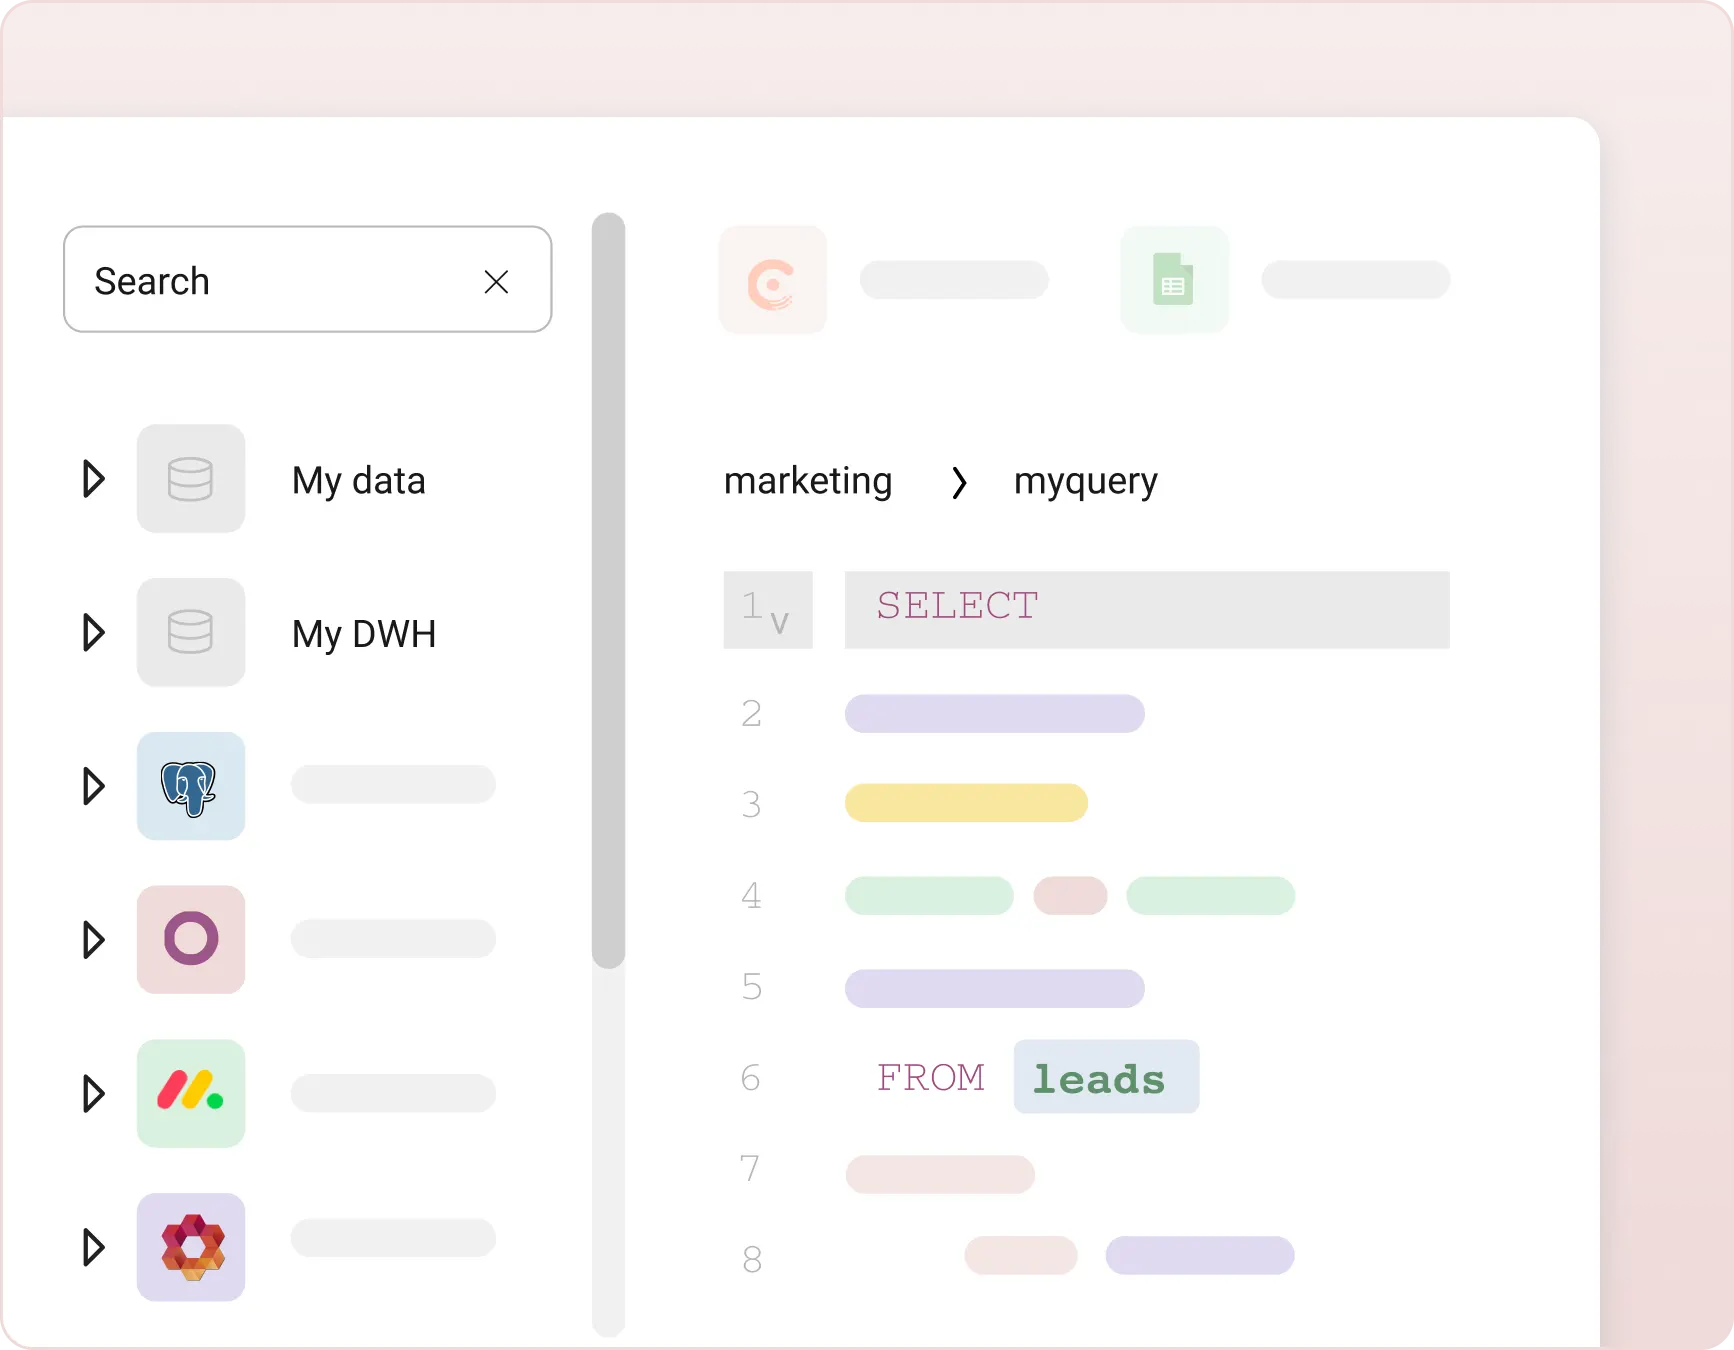
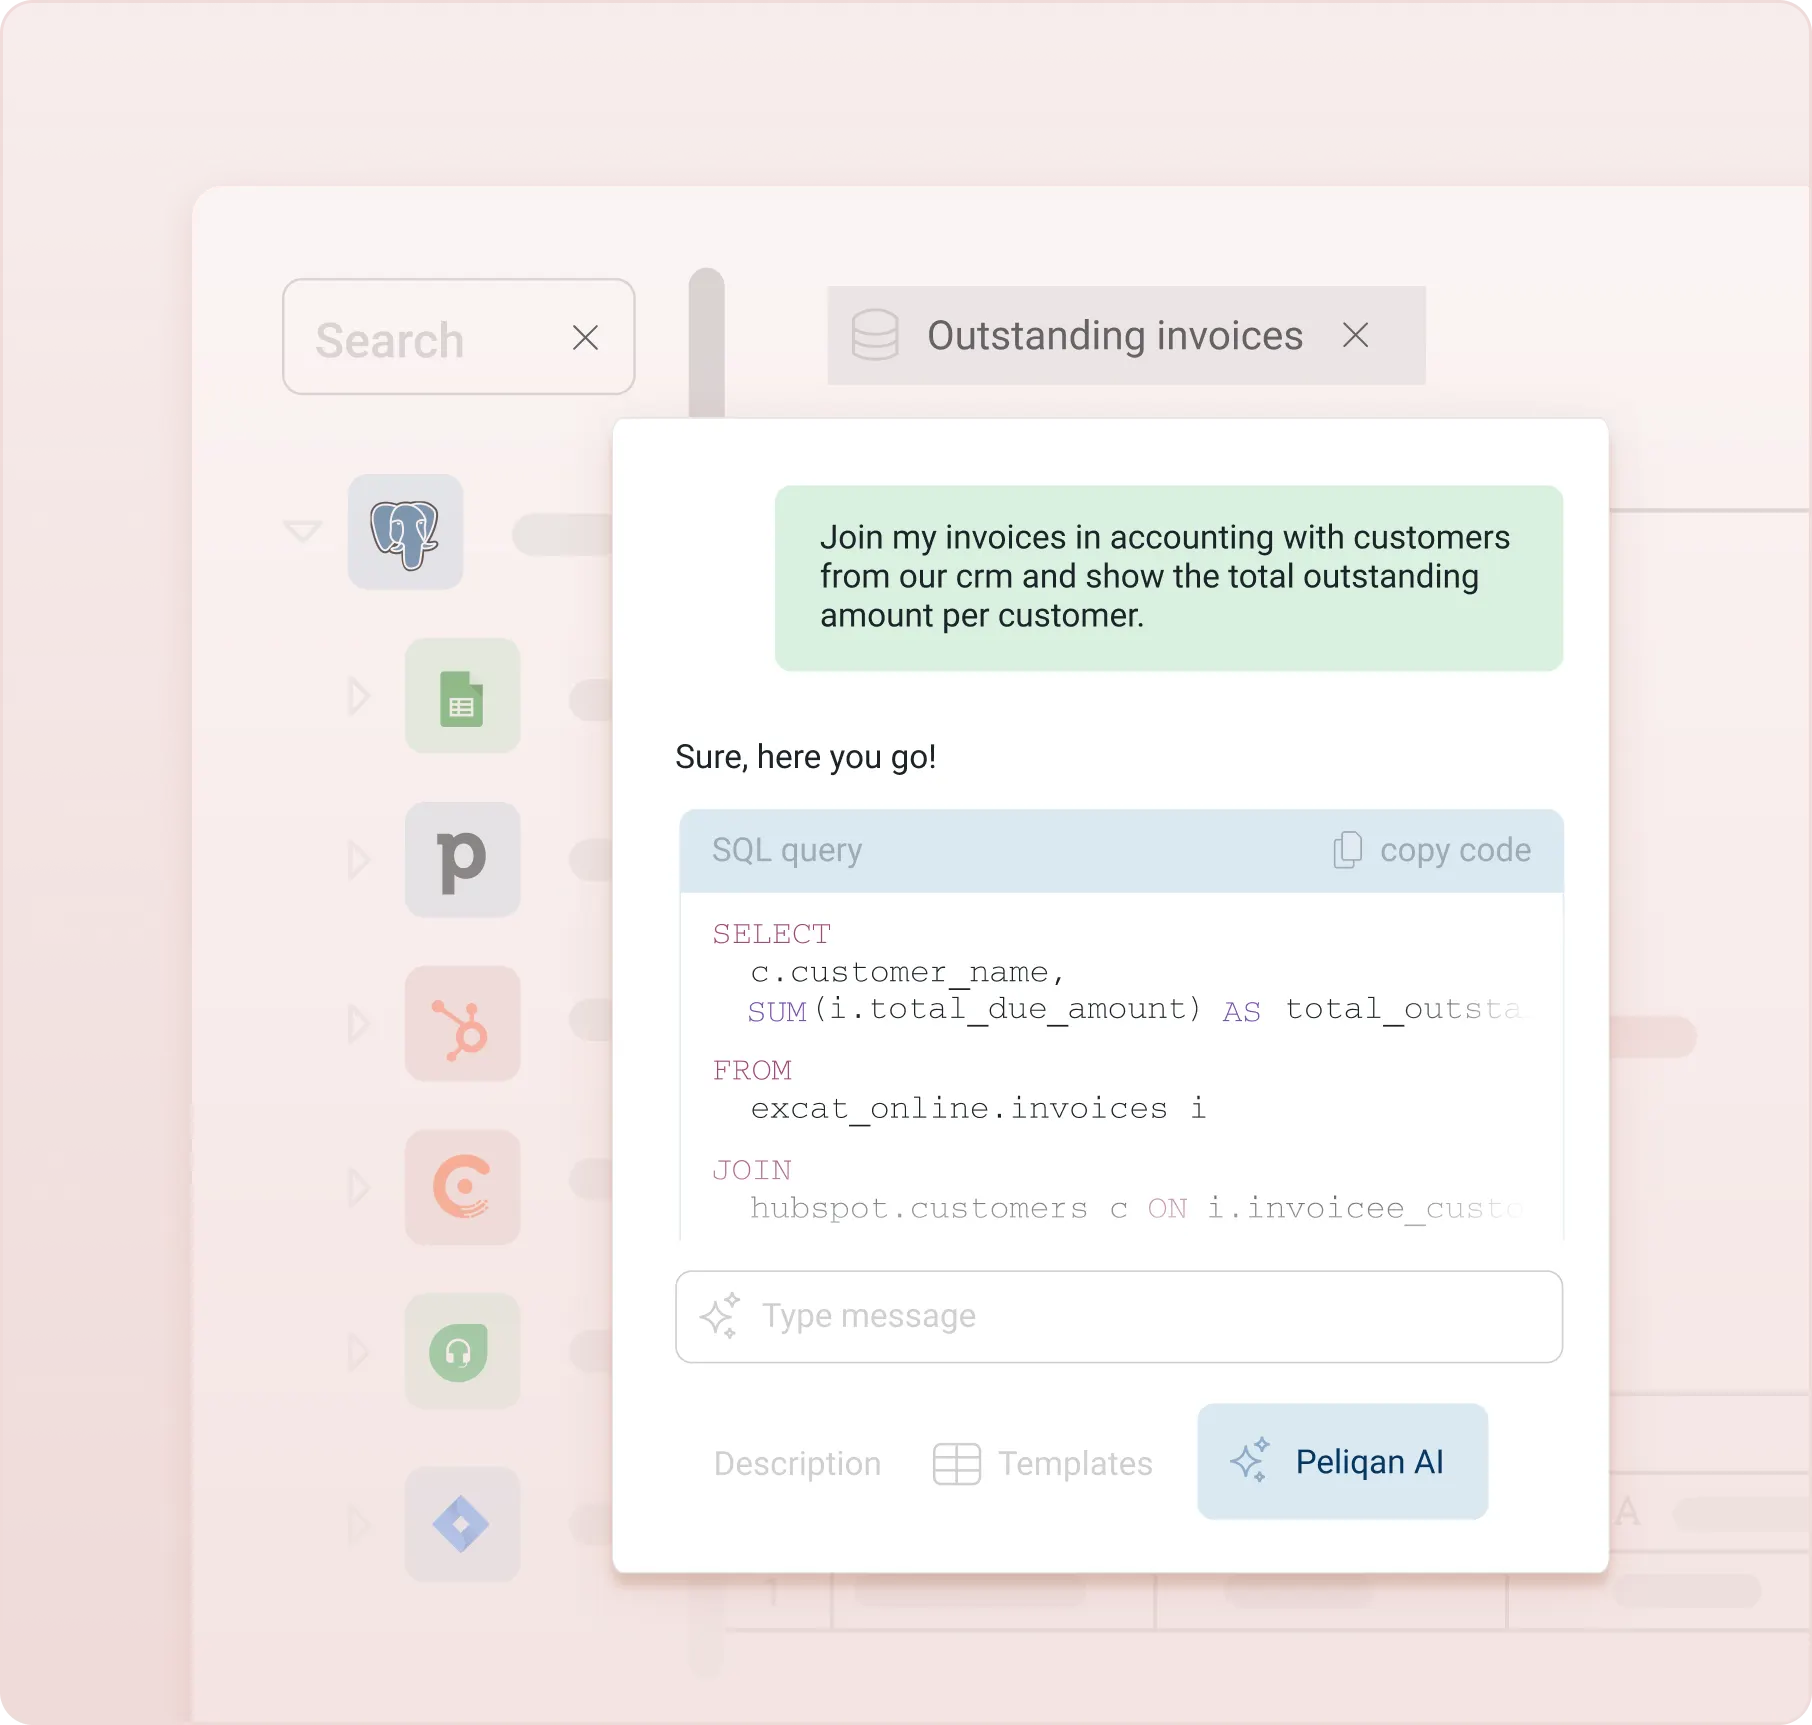
SQL on anything
Use SQL on your Salesforce data to view, share and transform data.